IRISA Platform Enhanced Characteristics
Introcuntion
As we embark on this chapter, we find ourselves in Phase Two of the NaviDEC project at IRISA. This phase, which is the focus of my internship, involves refining and enhancing the platform’s features. Before diving into the specific enhancements I made to the platform, I will first describe how I inherited the project, along with several challenges, which I will outline in the following section titled ‘Handover Highlights and Challenges’. An overview of the work carried out during Phase Two will then be provided. Following this overview, a detailed account of each task will be presented in the subsequent sections of this chapter, offering an in-depth look at the enhancements and improvements made to the platform. This will allow for a thorough understanding of the project’s progression and the solutions implemented to overcome the challenges faced
As for how I organized myself over the course of five months to carry out this project, I will describe the methodology I used to organize my work in the ‘Work Organization Methodology’ section in the chapter that follows this one.
Handover Highlights and Challenges
The project, which served as a Proof of Concept (PoC) for the IRISA platform, was transitioned to my responsibility under the following circumstances:
The transition of the Proof of Concept (PoC) IRISA platform project to me was a race against time. The engineer, who was my primary guide and the sole direct source of knowledge about the intricacies of the project’s platform code, was set to leave the IRISA institution in just two weeks. This narrow window of time presented a steep learning curve. I had to absorb as much information and understanding about the project as I could, knowing that after this brief period, I would be navigating the complexities of the project on my own. Despite the time constraints, the engineer was incredibly supportive, going above and beyond to ensure I was well-informed about the entire project and patiently answering all my queries.
The code for the Proof of Concept (PoC) IRISA platform project, which was handed over to me, contained deprecated elements and complex nested structures that added to the intricacy of the task at hand. This complexity necessitated a thorough understanding and subsequent refinement of the codebase.
There was a lack of comprehensive documentation and flow charts, making it challenging to grasp the overall structure and functionality of the project.
The architecture illustration provided was outdated, which meant that I had to invest time in understanding the current architecture and updating the illustration.
The main concentration is on the Testbed platform that has been provided, which is convenient for both PoC and demonstration. On the other hand, the integration with related partners in a real-world project necessitates the transformation of the software version of the IRISA platform into a hardware version. This transformation process involves eliminating certain tools, such as the Containernet network emulator, and adjusting specific parameters to facilitate the integration process, among other things. This will be carried out in phase 3 of the project, after the internship period.
This section aims to paint a picture of the initial challenges I faced at the start of my internship. As an intern with limited experience, I found myself responsible for a complex, working platform that required a long list of enhancements. This responsibility was both daunting and exciting, and it pushed me to quickly learn and adapt.
In the following, I will list all accomplished tasks for the IRISA Platform. Then, in the subsequent sections during this chapter, I will detail each of the accomplished tasks with specifics. Finally, in the last chapter, I will elaborate on the methodology I utilized to organize my work and the tasks I completed for the platform. This will offer a comprehensive understanding of how I navigated these initial challenges and made significant progress in enhancing the platform.
Accomplished Tasks for IRISA Platform
In the following sections, we will delve into a detailed discussion of each task and its significance in the overall project. The tasks are categorized as follows:
Mandatory Tasks:
These tasks formed the backbone of the project, encompassing the core responsibilities that were essential for the project's progression.
Additional Tasks:
These tasks were undertaken in the intervals between supervisor meetings. They served to deepen my understanding of the project and significantly enhanced the quality of my work.
Complementary Tasks:
While these tasks were not classified as mandatory or additional, they played a pivotal role in refining the project. Their contribution led to a more comprehensive and professional outcome.
The tasks spanned across various categories and included:
Code Understanding:
This was a mandatory task that required a combination of tasks across all categories.
Infrastructure Automation:
This additional task fell under the Platform Automation category.
Dockerfile Build Code:
This was a complementary task within the Platform Automation category.
Interactive Web-based Terminal:
This complementary task spanned across the Platform Automation, Development, Integration, and User Interface categories.
Bandwidth Visualization with API Development:
This mandatory task involved the Platform Implementation, Automation, Development, Integration, and User Interface categories.
Kubernetes Dashboard:
This mandatory task was part of the Platform Implementation, Automation, Development, Integration, and User Interface categories.
Flask Python Framework:
This complementary task was part of the Platform Migration and Development categories.
Comprehensive Logging System:
This complementary task was part of the Platform Documentation and Development categories.
Flowchart Diagram Illustration:
This additional task was part of the Platform Documentation and Development categories.
Online Documentation:
This mandatory task was part of the Platform Documentation, Development, and User Interface categories.
Automated Build and Deployment Pipeline in GitLab:
This complementary task was part of the Platform Automation category.
OpenVPN Integration:
This complementary task was part of the Platform Automation and Integration categories.
RPC Server Web Browser Launcher Tool:
This complementary task was part of the Platform Implementation, Automation, Development, Integration, and User Interface categories.
As we can see, a total of thirteen tasks were successfully accomplished: four were mandatory, two were additional, and seven were complementary. Regardless of their classification, each task played a crucial role in the successful execution and enhancement of the project.
Code Understanding
Introduction
Understanding the code was a progressive journey, unfolding with each task. Each completed task clarified the code's intricacies. The final task provided a comprehensive view of the codebase. Subsequent tasks, listed in an order that gradually contributed to code clarity, unlocked a clearer understanding with each step. Considering all tasks represents the journey in understanding the codebase.
Structure of the Following Sections
The subsequent sections in this chapter are each dedicated to a distinct task that has been completed. This method enhances clarity, and we will adhere to this structure wherever feasible.
Example Task: RPC SERVER WEB BROWSER LAUNCHER
The structure, accompanied by explanations, is organized as follows whenever feasible:
Introduction: Revolutionizing Remote Control with RPC Server Web Browser Launcher
A concise introduction to the task.
Why RPC Server Web Browser Launcher within IRISA Platform
An explanation of why this task is important.
Benefits of Integrating RPC Server Web Browser Launcher with IRISA Platform
The benefits derived from this integration.
In-Depth Examination of RPC Server Web Browser Launcher of IRISA Platform
A simplified breakdown of the code, avoiding technical jargon as much as possible.
Illustration: RPC Server Web Browser Launcher
Present the pertinent image, where applicable.
In summary
Recap of the role that the intended tool plays in IRISA platform, where applicable.
Code Repository
Provide the link to the specific file or folder that substantiates the explained task, where applicable.
Ansible Playbook, An Infrastructure Automation Tool
Introduction: Leveraging Ansible for Infrastructure Orchestration
In the dynamic landscape of modern infrastructure management, the IRISA platform harnesses the power of Ansible, a robust open-source automation tool, to streamline and automate server configuration. Ansible's versatility and simplicity make it an ideal choice for orchestrating complex tasks, offering a range of benefits that significantly contribute to the efficiency and reliability of the IRISA Platform.
Why Ansible?
At the core of the IRISA platform's infrastructure automation lies the Ansible playbook configure_server.yml. Ansible, known for its agentless architecture and YAML-based syntax, provides a declarative language for describing system configurations, making it an excellent fit for platform. The choice of Ansible aligns with the project's commitment to simplicity, flexibility, and scalability,, as highlighted by the following advantages when compared with other tools:
Simplicity and Ease of Use:
Ansible is known for its simplicity and ease of use. It uses YAML-based "playbooks" to configure systems, deploy software, and orchestrate advanced workflows [1]. This makes it easier to read and write compared to the domain-specific languages used by Puppet and Chef [2].
Agentless Architecture:
Unlike Puppet, Chef, and Salt, Ansible does not require the installation of an agent on managed nodes. This simplifies the deployment process and reduces the resources required on the servers you are managing.
Flexibility:
Ansible has great flexibility in the types of workloads it can effectively run. It is suited to critical production environments where there is a greater need for granular control [3].
Strong Support for Cloud-Based Infrastructure:
Ansible has robust support for cloud-based infrastructure [1], making it a good choice if you're working with cloud platforms.
Imperative Programming Paradigm:
Ansible allows users to script commands in an imperative programming paradigm [4], which can be more intuitive for users who are used to scripting and procedural programming [2].
Community and Enterprise Support:
Ansible has a large community of global contributors and is backed by Red Hat, which offers enterprise support [1].
Benefits of Ansible within IRISA Platform
Here are some benefits of using Ansible within the IRISA platform:
Consistency and Reproducibility:
Ansible ensures consistent server configurations across different environments. By defining tasks in a playbook, the IRISA team can reproduce the same infrastructure settings reliably, minimizing the risk of configuration drift and ensuring consistency in deployments.
Efficiency in Configuration Management:
The configure_server.yml playbook encapsulates a series of tasks, ranging from system checks to software installations. Ansible's idempotent nature ensures that running the playbook multiple times does not cause unintended changes, providing efficiency in configuration management without unnecessary modifications.
Cross-Platform Compatibility:
Ansible's agnostic approach to underlying infrastructure allows seamless management of heterogeneous environments. Whether the target is a local development machine or a remote server, Ansible abstracts away the complexity, allowing the IRISA team to focus on tasks rather than platform intricacies.
Collaborative Development:
The playbook serves as a collaborative artifact, capturing the expertise of the IRISA team in a human-readable format. Ansible playbooks are version-controlled, facilitating teamwork, code reviews, and knowledge sharing among team members, contributing to a transparent and collaborative development process.
Extensibility and Integration:
Ansible's extensive library of modules and integrations simplifies the integration of diverse technologies within the Platform. From SSH session configurations to the installation of Docker, Containernet, and various packages, Ansible empowers the project to integrate seamlessly with a wide array of tools.
Auditability and Documentation:
The declarative nature of Ansible playbooks enhances auditability. Each task within configure_server.yml serves as self-documenting code, making it easier for team members to understand, modify, and maintain the infrastructure over time. This contributes to a robust documentation culture within the Platform.
In-Depth Examination of Ansible Playbook Operations of IRISA Platform
The configure_server.yml playbook is crafted to set up the server intended for use in the IRISA platform. It undertakes the following tasks:
Configuration for localhost
Specify target hosts as localhost.
Gather facts about the system.
Execute tasks with elevated privileges.
Checking Ubuntu Version
Ensure the target system is running Ubuntu 20.xx.
Set SSH Session Timeout Settings
Set TCPKeepAlive, ClientAliveInterval, ClientAliveCountMax in SSH configuration.
Restart the SSH service.
Add NOPASSWD Rule to sudoers
Add a NOPASSWD rule to the sudoers file.
Print success or error messages.
Setup Current Directory and Destination Directory
Get the current directory.
Set the destination directory based on the current directory.
Copy run.sh from navidec to parent directory
Copy the run.sh file from navidec to the parent directory.
Change the owner of run.sh.
Set Date, Time, and Timezone
Ensure NTP is installed.
Set the system timezone to Europe/Paris.
Synchronize system time with an NTP server.
Display the current date and time.
Install OpenVPN
Update packages and install required packages.
Add OpenVPN repository key and repository.
Install OpenVPN.
Configure OpenVPN settings.
Restart OpenVPN Access Server.
Install Containernet
Check if Containernet repository already exists.
Remove existing Containernet repository if it exists.
Clone Containernet repository.
Run Containernet install playbook.
Update package list and Install packages
Update the package list.
Install packages: sshpass, latexmk, texlive-fonts-recommended, texlive-latex-extra, texlive-fonts-extra.
Install Kubectl
Download and install Kubectl.
Remove the Kubectl setup file.
Install Sysbox
Download and install Sysbox.
Install jq.
Remove Sysbox setup file.
Check Sysbox service status.
Start Sysbox service if inactive.
Update Docker daemon and restart it
Insert a line into the Docker daemon configuration.
Restart the Docker daemon.
Install packages
Install Python packages using pip3.
Install Node.js and nodemon
Remove existing Node.js and NodeSource repository configurations.
Remove NodeSource repository list file.
Remove NodeSource GPG key.
Update and install required packages.
Download NodeSource GPG key.
Save GPG key to /etc/apt/keyrings/nodesource.gpg.
Add NodeSource to sources list.
Update and install Node.js.
Check Node.js version.
Print Node.js version.
Upgrade npm using sudo.
Print npm upgrade result.
Install nodemon using sudo or npm.
Print nodemon installation result.
Export COLORTERM=truecolor to current user
Get the current user.
Determine the user's home directory.
Check and add export COLORTERM=truecolor to ~/.bashrc if not present.
Create docker group & add current user to it
Get the current non-root remote user.
Add docker group.
Add the user to the docker group.
The playbook covers a range of configurations, from system settings to the installation of various tools and applications, aimed at setting up a server environment for development and containerization.
Playbook Usage
The playbook can be run using the following command:
Before deploying IRISA Platform, it is a prerequisite to prepare the server. The server should be running Ubuntu 20.04 LTS.
First, establish an SSH connection to the remote Ubuntu server and initiate the installation of Ansible on a freshly installed version of Ubuntu 20.xx:
sudo apt-get update && sudo apt-get install ansible -y
Next, clone the NaviDec repository:
git clone -b master https://gitlab.inria.fr/muhammad.al-qabbani/navidec.git
Lastly, run the Ansible playbook to install the required dependencies:
sudo ansible-playbook -i "localhost," -c local navidec/ansible/configure_server.yml && exit
After the installation is complete, the current active terminal session will automatically log out. Logging back in will ensure that the Docker group membership is re-evaluated.
Note
It is assumed that Ansible is installed on the system for this playbook.
Warning
Be cautious when making changes to system configurations, especially when using become and sudo privileges.
In Summary
In essence, the incorporation of Ansible in the IRISA Platform is a strategic decision aimed at achieving not just automation but a sustainable, scalable, and collaborative approach to infrastructure management. As we delve into the details of the configure_server.yml playbook, the power of Ansible unfolds, showcasing its role in shaping the robust and efficient infrastructure that underpins the IRISA platform.
Code Repository
Please refer to the configure_server.yml playbook source code for detailed task configurationsm [5] [6].
For more details, Click here to view the playbook source code.
Docker Container Automation
Introduction: Embracing Docker for Containerized Efficiency
In the ever-evolving landscape of modern software development, the IRISA platform strategically adopts Docker, an industry-standard containerization tool, to elevate the efficiency and consistency of its container orchestration. Docker's lightweight, portable containers offer a versatile solution, providing a multitude of benefits that significantly enhance the deployment and scalability aspects of the IRISA Platform.
Why Docker?
At the heart of the IRISA platform's containerization strategy lies the Dockerfile Dockerfile.cnet_nind. Docker, renowned for its containerization approach and user-friendly workflows, emerges as the ideal choice for encapsulating applications and dependencies within isolated environments. This choice aligns seamlessly with the IRISA Platform's pursuit of scalability, consistency, and seamless deployment.
Docker offers several advantages over traditional virtual machines (VMs):
Efficiency:
Docker containers are lightweight and share the host system's kernel, making them more resource-efficient than VMs. This allows you to run more Docker containers on a given hardware combination than VMs [7].
Portability:
Docker containers can run anywhere, on any machine that has Docker installed, without worrying about the underlying system. This makes it easy to develop on one machine, test on another, and deploy on a third, all without any hiccups [7].
Speed:
Docker containers are faster to launch than VMs because they don't need to boot up a full operating system [8].
Docker Hub:
Docker has a large repository of images available from Docker Hub, which can be used as a starting point for your own applications [9].
Broad Functionality:
Docker is a comprehensive platform that includes a container runtime, image build tools, a registry for hosting container images, and an orchestration engine. This broad functionality makes Docker a one-stop solution for many developers [9].
Large Community and Ecosystem:
Docker has a large community of users and developers, which means you can find a wealth of resources, tutorials, and pre-built images to help you get started [9].
Benefits of Using Docker within IRISA Platform
Here are some benefits of using Docker within the IRISA platform:
Isolation and Portability:
Docker containers encapsulate applications and their dependencies, ensuring isolation from the underlying infrastructure. This isolation guarantees consistent behavior across various environments, facilitating portability and eliminating the notorious "it works on my machine" issue.
Efficient Resource Utilization:
Docker's lightweight containers share the host OS kernel, optimizing resource utilization. This efficiency translates into faster start-up times, reduced overhead, and the ability to run multiple containers on a single host without compromising performance.
Streamlined Development Workflow:
The Dockerfile Dockerfile.cnet_nind serves as a declarative script for defining the container's environment. This script simplifies the development workflow, allowing the IRISA team to codify dependencies, configurations, and application setup in a consistent and reproducible manner.
Consistent Deployments Across Environments:
Docker ensures consistency between development, testing, and production environments. The containerized application, defined by the Dockerfile, guarantees that what is developed and tested locally mirrors the production environment, reducing deployment-related surprises.
Scalability and Microservices Architecture:
Docker facilitates the adoption of a microservices architecture, allowing the IRISA Platform to break down monolithic applications into smaller, manageable components. This scalability enables more straightforward maintenance, updates, and a modular approach to development.
Version Control and Image Repositories:
Docker introduces version control to containerized applications through images. The Dockerfile, when combined with version control systems, enables the IRISA team to track changes systematically. Docker Hub or other container registries store and distribute these versioned images, facilitating collaboration and seamless deployment.
Fast and Reproducible Builds:
The Dockerfile automates the build process, ensuring fast and reproducible builds. This accelerates the development lifecycle, allowing the IRISA team to iterate quickly, test efficiently, and deploy with confidence.
Simplified Dependency Management:
The Dockerfile explicitly defines dependencies and their configurations. This not only simplifies the installation process but also mitigates potential conflicts, ensuring that each containerized instance runs with precisely the required dependencies.
In essence, the integration of Docker within the IRISA Platform is a strategic choice aimed at optimizing the development, deployment, and scalability aspects. The Dockerfile Dockerfile.cnet_nind stands as a testament to the power of Docker, showcasing its role in crafting a streamlined and efficient container orchestration environment for the IRISA platform. This document provides a comprehensive overview of the Dockerfile, delving into its intricacies and highlighting the transformative benefits it brings to the IRISA Platform.
In-Depth Examination of the Dockerfile.cnet_nind Operations within IRISA Platform
The Dockerfile.cnet_nind serves as a blueprint for creating a Docker image tailored to the infrastructure needs of the IRISA Platform. It orchestrates the installation of essential tools, configurations, and dependencies within a Docker container. Let's break down the content of the Dockerfile:
Base Image:
Specifies the base image as ubuntu:22.04, laying the foundation for subsequent installations and configurations.
Setting Timezone:
Sets the timezone within the container to Europe/Paris (ENV TZ=Europe/Paris), ensuring consistent time settings.
Installing Basic Tools:
Updates the package list and installs various tools, including curl, iputils-ping, apt-utils, lsof, sudo, and others, to establish a robust development environment.
Python and Pip Installation:
Installs Python 3 and pip, ensuring the availability of essential Python packages for subsequent tasks.
Docker Installation:
Downloads and installs Docker using the official installation script, equipping the container with Docker capabilities for managing and running containers.
Minikube Installation:
Installs Minikube, a tool for running Kubernetes clusters locally, enhancing the container's capability to simulate Kubernetes environments.
Kubectl Installation:
Installs Kubectl, the Kubernetes command-line tool, facilitating interaction with Kubernetes clusters.
Helm Installation:
Installs Helm, the Kubernetes package manager, using a script, providing a mechanism for deploying and managing applications on Kubernetes.
Nginx Installation:
Installs Nginx, the popular web server, to support web server functionality within the container.
Cleaning Up:
Executes cleanup commands, removing unnecessary packages and optimizing the size of the final Docker image.
Entrypoint Script:
Copies an entrypoint script (startup-nind.sh) into the container. This script contains instructions to be executed when the container starts.
In-Depth Examination of Entrypoint Script Operations within IRISA Platform
The startup-nind.sh script, designated as the entry point for the Docker container, plays a crucial role in orchestrating various tasks upon container initialization. Let's delve into its functionalities:
Command-Line Argument Parsing:
The system parses command-line arguments, specifically looking for the --delete-minikube flag. If this flag is detected, it initiates the deletion of the Minikube cluster. Notably, this flag is utilized automatically during the Docker image creation process as a cleanup mechanism.
Docker API Accessibility Check:
Ensures the Docker daemon is running and restarts it if necessary. If the Docker API is not accessible, the script restarts the Docker daemon, guaranteeing a stable environment for subsequent operations.
Minikube Startup:
Initiates the Minikube cluster, verifying the availability of the Docker daemon. If Minikube fails to start, the script retries the operation after deleting the existing Minikube cluster.
Deleting Minikube Cluster:
If the --delete-minikube flag is set, the script deletes the Minikube cluster and exits gracefully.
Starting Nginx:
Starts the Nginx web server, facilitating web server functionality within the container.
Continuous Docker Daemon Monitoring:
Enters a loop, periodically invoking the check_docker function to ensure the Docker daemon remains running throughout the container's lifecycle.
In summary
The Dockerfile.cnet_nind orchestrates the construction of a Docker image with a comprehensive set of tools and configurations. From foundational utilities to advanced technologies like Docker and Kubernetes, the Dockerfile ensures that the resulting container is well-equipped for development, testing, and container orchestration within the IRISA Platform's ecosystem.
startup-nind.sh serves as the orchestrator for initializing the Docker container. It checks and ensures the availability of the Docker daemon, starts Minikube with necessary configurations, and commences Nginx for web server functionality. The script exhibits a dynamic quality by continuously monitoring and restarting the Docker daemon when needed, ensuring a resilient and stable containerized environment.
This script aligns seamlessly with the overarching purpose of the Dockerfile.cnet_nind, contributing to the comprehensive set of tools and configurations that make the resulting Docker image well-suited for development, testing, and container orchestration within the IRISA Platform's ecosystem.
Code Repository
For more details, Click here to view the Dockerfile.cnet_nind source code.
For more details, Click here to view the startup-nind.sh source code.
Interactive Web-based Terminal
Introduction: Harnessing Power of xterm.js for Interactive Web Terminals
The IRISA Platform presents an innovative web-based terminal system, developed in Node.js and powered by xterm.js. This system consolidates four terminals into a single, user-friendly page, ensuring a responsive design and automated execution. The interactive terminal allows command execution, process monitoring, and interaction with the platform environment, all from one place, which enhances productivity and convenience.
Why xterm.js?
Initially, the platform used Xterm, a terminal emulator for the X Window System, which provides a command-line interface for users to interact with the system. Xterm is typically used on Unix-like operating systems. However, when four Xterm windows are run, they pop up from the SSH terminal in an unorganized manner, making it difficult to align and track them each time the platform runs. Furthermore, executing commands manually in each window adds to the burden and is time-consuming.
To address the need for organizing four terminals inside one window, running simultaneously and with automated execution, Xterm.js was implemented. Xterm.js is a JavaScript library that enables the building of terminal applications that run in a web browser.
Here are some of its key features:
Terminal apps compatibility:
Xterm.js works with most terminal apps such as bash, vim, and tmux, including support for curses-based apps and mouse events [10], [11].
Performance:
Xterm.js is really fast and even includes a GPU-accelerated renderer [10], [11].
Rich Unicode support:
Self-contained:
It's used in several world-class applications to provide great terminal experiences, such as SourceLair, an in-browser IDE, and Microsoft Visual Studio Code, a modern, versatile, and powerful open-source code editor [12].
Benefits of xterm.js within IRISA Platform
Here are some benefits of using xterm.js within the IRISA platform:
Responsive Web Design (RWD):
xterm.js ensures a responsive user interface, adapting to various screen sizes and resolutions. This responsiveness enhances the user experience, allowing for optimal terminal interaction across different devices.
Integration with Python and Node.js:
The integration of xterm.js with both Python and Node.js showcases its flexibility in accommodating diverse technologies. This compatibility facilitates a seamless connection between server-side logic (Python) and client-side interactivity (JavaScript).
Four Terminals in a Single Page:
NaviDEC leverages xterm.js to organize and manage four terminals efficiently within a single web page. This organization enhances the user's ability to work with multiple instances, promoting a streamlined and organized terminal experience.
Fully Automated Execution:
Xterm.js contributes to the IRISA Platform's efficiency by enabling fully automated executions. This ensures that complex tasks, configurations, and interactions within the terminals are handled effortlessly, minimizing manual intervention.
In-Depth Examination of xterm.js Integration within IRISA Platform
The xterm.js integration involves configuring and managing four terminals within a web page. The server.js file orchestrates this integration, utilizing express, socket.io, and node-pty to create, control, and communicate with the terminals. The accompanying index.html file establishes the structure for rendering the terminals within the browser.
By combining xterm.js with NaviDEC's Python and Node.js subprojects, the project achieves a sophisticated yet user-friendly solution for interactive web-based terminals. The seamless integration of xterm.js aligns with the IRISA team's commitment to providing an efficient and powerful platform.
Implementation Details:
The subproject is implemented using Node.js, Express, and the xterm.js library. The server.js file acts as the backend server, facilitating communication between the client and the terminals. Each terminal instance is created using the xterm.js library and is connected to the server through Socket.IO.
Terminal Organization:
The terminals are organized within a flex container, allowing for a responsive and visually appealing layout. Each terminal container includes a header displaying the terminal's purpose, such as "Terminal 1 (Boat)," providing users with clear context for each terminal's role.
Terminal Initialization:
Upon connection to the server, each terminal is initialized with specific commands relevant to the IRISA Platform. This includes tasks such as starting services, executing scripts, and configuring network elements.
User Interaction:
Users can interact with the terminals by entering commands, and the output is dynamically displayed in the corresponding terminal window. Additionally, the web-based terminal interface supports resizing, adapting to changes in the browser window size.
Illustration: Embedding four Xterm.js Terminals into IRISA Platform Web Browsers
Here are three figures comparing and illustrating the previous layout of four Xterm terminals with the enhanced version, showcasing the integration of Xterm.js into web browsers on the IRISA platform.
Previously, on an outdated feature on platform, the display of four Xterm terminals used to appear as scattered pop-ups from an SSH terminal. However, recent enhancements have rendered this feature obsolete.
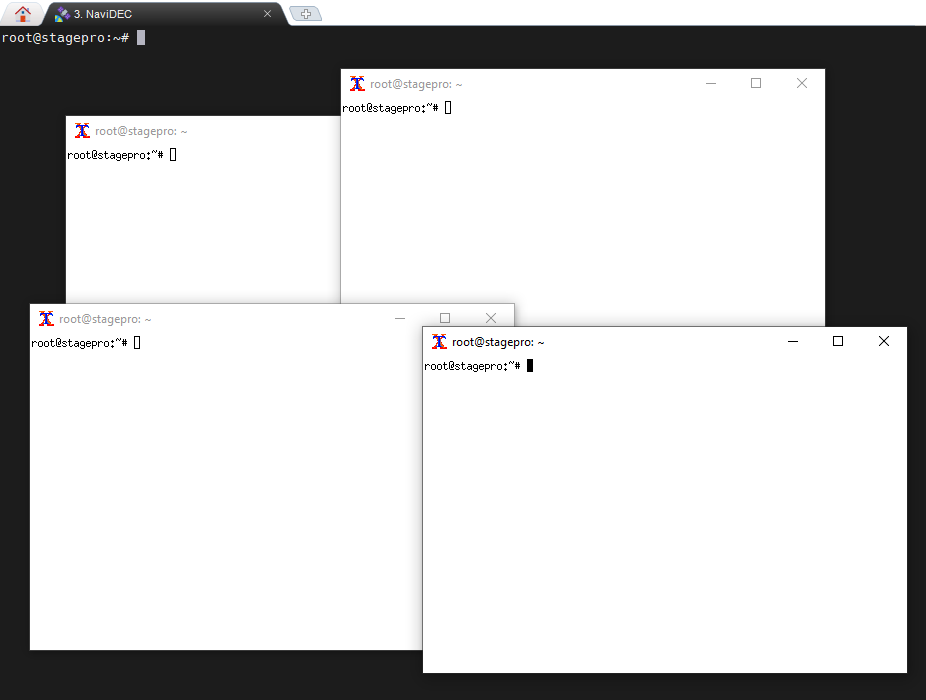
Visualization of the outdated and deprecated feature: Four Xterm Terminals displayed as scattered pop-ups originating from an SSH Terminal.
The next illustration presents a web browser with an open tab directed to the server name, followed by its port address, specifically, http://stagepro.tk:3001. Within this browser, four interactive web terminals, powered by xterm.js, are displayed:
Terminal 1, located at the upper left, represents the Boat.
Terminal 2, situated at the upper right, signifies the Edge.
Terminal 3, found at the lower left, represents the first instance of the Host.
Terminal 4, located at the lower right, represents the second instance of the Host.
When the browser is automatically opened, this tab activates, triggering a series of automated commands on each terminal:
Terminal 1 initiates the NaviDEC REST API.
Terminal 2 also runs the NaviDEC REST API.
Terminal 3 sends an automated request to the NaviDEC REST API on Terminal 1 (the Boat), deploying the streaming and classifier resources. It then begins monitoring the current streaming bandwidth, which is currently indicated as 'BAD' due to low speed.
Terminal 4 runs the Meta Orchestrator via an automated command, listing all available terminals. Here, 'cluster1' for the Boat and 'cluster2' for the Edge are visible.
Under low-speed conditions, Terminal 1 displays the streaming and classifier deployments along with their services. In contrast, Terminal 2, representing the Edge, shows no deployed resources.
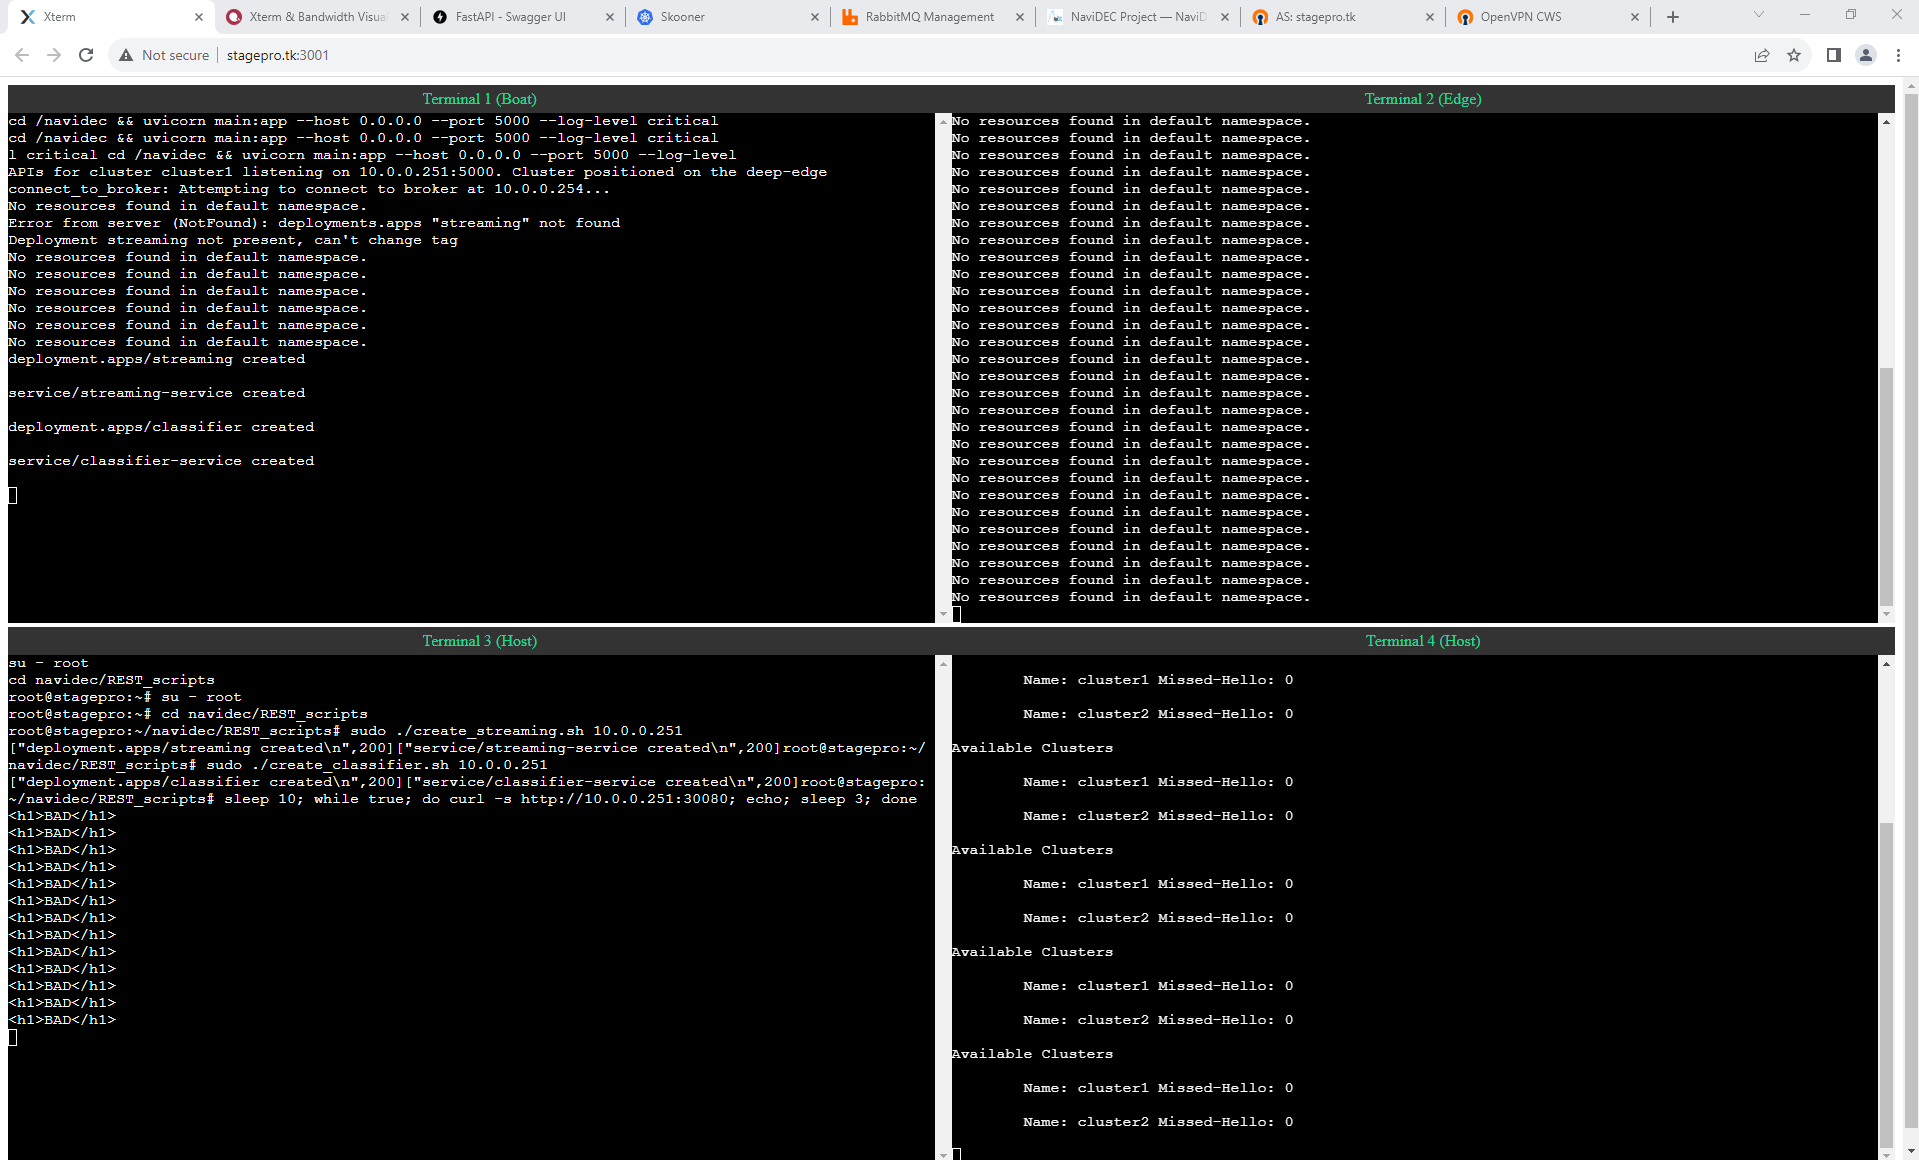
Display of Four Xterm.js Terminals Embedded in Web Browsers Under Low Bandwidth Condition.
Now, since the bandwidth has improved to high, as indicated by the 'GOOD' status in Terminal 3 of the Host, we can observe changes in the resources:
The streaming deployment tag in cluster1 on Terminal 1 (Boat) has changed to 'Good'. then, the classifier deployment resource has been deployed in cluster2 on Terminal 2 (Edge) and removed from cluster1.
In Terminal 1, we can see the 'AbroadResources' that contain the classifier service and deployment.
In Terminal 2, within cluster2, the 'ForeignResources' are shown for the classifier service and deployment.
Terminal 4 (Host) continues to update the available clusters, and we can see the list for cluster1 and cluster2.
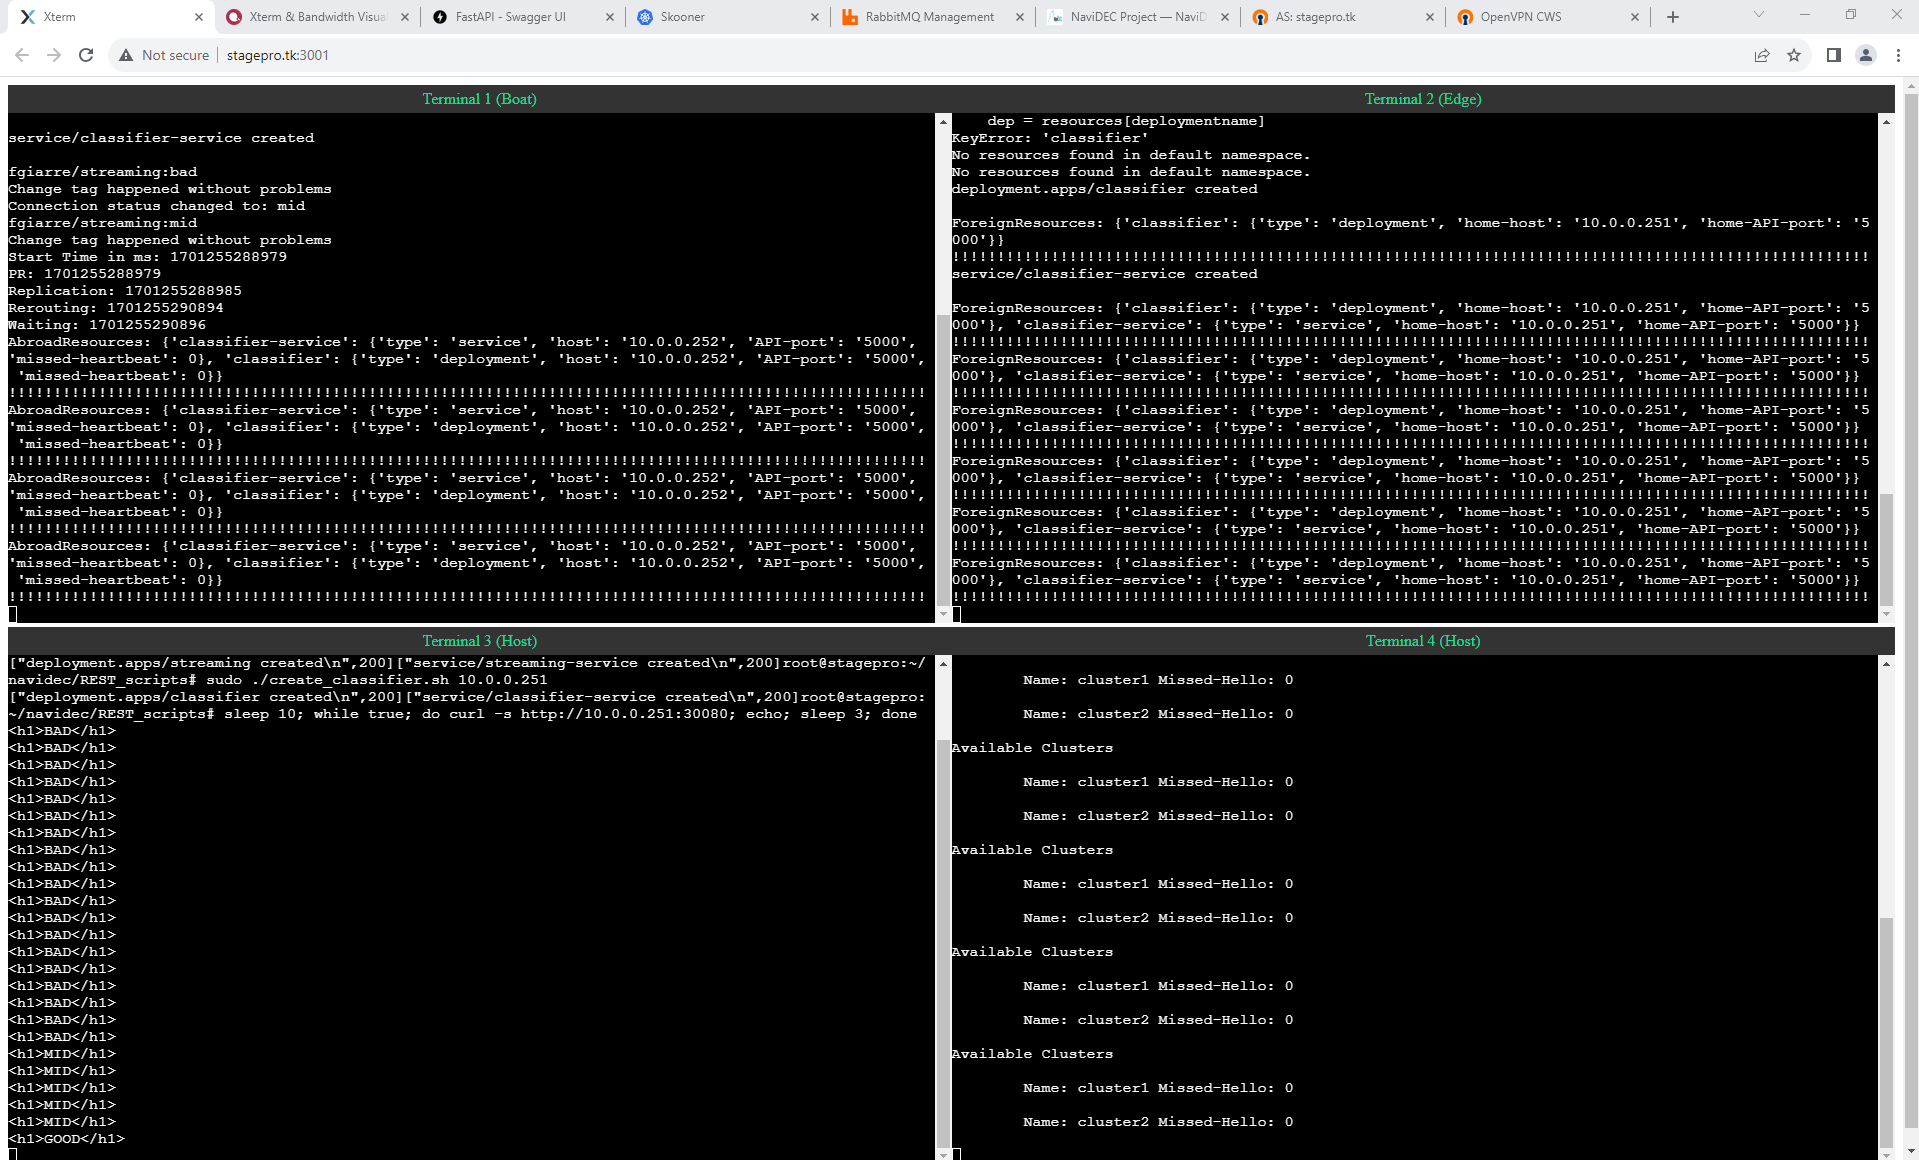
Display of Four Xterm.js Terminals Embedded in Web Browsers Under High Bandwidth Condition.
In Summary
This web-based terminal subproject exemplifies the IRISA Platform's commitment to user-friendly interfaces, automation, and efficient development practices. Developers and users alike can benefit from the enhanced workflow and interaction capabilities offered by this innovative terminal solution [13].
Code Repository
The source code for this subproject is available in the NaviDEC repository. This provides developers with the opportunity to explore, contribute to, and enhance the web-based terminal interface. One may access the repository at the following path: NaviDEC Repository.
Bandwidth Visualization
Introduction: Unleashing the Potential of Apache ECharts for Dynamic Bandwidth Visualization
In the dynamic realm of data representation and interactive visualizations, the IRISA Platform is at the forefront of leveraging cutting-edge technologies to craft a seamless and intuitive user experience. A notable stride in this pursuit of excellence manifests in the strategic adoption of Apache ECharts, a robust JavaScript charting library renowned for its versatility and rich feature set.
Apache ECharts is the fundamental tool for visualizing dynamic bandwidth within the platform. It provides users with a clear and detailed view of bandwidth performance. The Stage Speed Gauge, a charting element of Apache ECharts, coupled with real-time data updates, enhances the user's understanding of network bandwidth. This innovative solution ushers in a new phase of network bandwidth management, offering users an unparalleled level of insight and control.
Why Apache ECharts?
Initially, the platform lacked real-time bandwidth visualization and an API to read the bandwidth. Instead, there was a JSON text file that allowed manual bandwidth changes. However, this method did not provide a way to know the actual value unless the file was manually opened and checked. This led to the integration of Apache ECharts, a decision driven by its ability to adapt seamlessly to diverse data sources, its support for interactive features, and its capacity to render visually appealing charts.
The file has been replaced with an API called "Bandwidth Rotator" that generates a preset number every minute. A manual mode has also been integrated as a control bar on the same page. This allows manual control over the auto mode of the Bandwidth Rotator API, serving as an extra feature for platform demonstration in case the end user wants to give it a try. Both auto and manual modes will reflect the change in real time to the bandwidth gauge, an ECharts visualization. The web browser incorporates the API and a socket for backend connection.
Apache ECharts has several advantages over other charting libraries like Highcharts, Google Charts, D3.js, Plotly.js, and amCharts:
License:
Apache ECharts is an open-source library under the Apache License 2.0, allowing free usage and modification for both personal and commercial purposes. On the other hand, Highcharts is a commercial library that requires the purchase of a license for commercial use [14], and amCharts also has a proprietary license [14].
Compatibility:
ECharts supports a wider range of platforms including Browser, mobile devices, and node.js, making it versatile for various applications [15]. Google Charts primarily focuses on browser compatibility but does not have native support for node.js [16].
Customization Options:
ECharts provides a rich set of customizable options, allowing developers to create unique and visually appealing charts. It has a wide range of chart types, themes, and animation effects [15].
Performance and Rendering:
ECharts is optimized for large-scale data visualization and provides smooth rendering even with thousands of data points. It also utilizes a lightweight canvas-based rendering engine for better performance [15] [17].
Community Support and Documentation:
ECharts has a growing and active community, with regular updates and improvements. The library is well-documented, providing extensive guides and examples to help developers get started quickly [17].
Ease of Use:
ECharts is considered more beginner-friendly compared to D3.js2. Its high-level API and built-in chart types make it easier to create basic visualizations without extensive coding knowledge [18].
Benefits of Apache ECharts Bandwidth Visualization within IRISA Platform
The integration of Apache ECharts for bandwidth visualization within the IRISA platform offers several benefits:
Intuitive Representation:
The Stage Speed Gauge effectively translates complex bandwidth metrics into a visually intuitive language. This allows users to quickly interpret the gauge's readings, providing them with immediate insights into the quality of their LTE internet connection. The gauge indicates whether the bandwidth is low, medium, or high. This intuitive representation simplifies the understanding of intricate LTE internet connection metrics, making it easier for users to monitor and manage their connection quality.
Real-Time Bandwidth Monitoring:
Leveraging Apache ECharts' real-time capabilities, the Stage Speed Gauge ensures that users receive instantaneous feedback on bandwidth fluctuations.
Visual Appeal:
The gauge's visual clarity promotes user engagement by presenting bandwidth data in a format that is both visually appealing and comprehensible.
Adaptability:
Apache ECharts seamlessly adapts to diverse data sources, making it a versatile tool for various applications.
Interactive Features:
The support for interactive features enhances user engagement and facilitates a more intuitive understanding of data.
Customizable Thresholds:
Tailored to the unique needs of the IRISA Platform, the Stage Speed Gauge supports customizable thresholds, enabling users to set parameters that align with specific performance criteria. This customization empowers users to define what constitutes optimal network speed.
Manual Control:
The addition of a manual mode allows users to take control over the auto mode of the Bandwidth Rotator API, providing an extra feature for platform demonstration.
Backend Connection:
The web browser incorporates the API and a socket for backend connection, ensuring smooth data flow and timely updates.
Responsive Web Design (RWD):
The platform is designed with RWD principles, ensuring optimal viewing and interaction experience across a wide range of devices.
Integration with Python and Node.js:
The platform integrates seamlessly with Python and Node.js, expanding its capabilities and allowing for more complex operations.
Fully Automated Execution:
The platform supports automated execution, reducing manual intervention and increasing efficiency.
These enhancements significantly improve the platform's functionality and user experience, making it a more powerful tool for network monitoring and management.
In-Depth Examination of Bandwidth Visualisation of IRISA Platform
Here is an overview of the functionalities provided by the bandwidth visualization subproject:
HTML Structure (`bandwidthvisualization/index.html`):
Defines the structure of the HTML page for bandwidth visualization.
Includes necessary external libraries such as xterm.js, Socket.IO, noUiSlider, and ECharts.
Utilizes inline and external styles for layout and aesthetics.
Sets up two main sections: a terminal (#terminal) and a chart (#chart-container).
Integrates a slider (#slider) for adjusting bandwidth manually.
Includes JavaScript scripts for terminal functionality (bandwidthvisualizationChart.js and sliderBandwidthController.js).
Server Configuration (`bandwidthvisualization/server.js`):
Creates an Express server with Socket.IO for handling WebSocket connections.
Listens on port 3002.
Serves static files, including the HTML file.
Manages WebSocket connections to facilitate real-time communication with clients.
Spawns a pseudo-terminal (pty) for command execution and communication with the client terminal.
Receives and logs RabbitMQ credentials and a unique token from the server.
Provides an endpoint (/hostname) to get the server's hostname.
Bandwidth Visualization Chart (`bandwidthvisualization/bandwidthVisualizationChart.js`):
Retrieves the server hostname asynchronously.
Initializes an ECharts instance for bandwidth visualization.
Configures a gauge chart with two series: one for bandwidth and another for outer labels.
Establishes a WebSocket connection with the server for real-time updates.
Listens for 'bandwidth_update' events and updates the chart accordingly.
Handles chart resizing on window resize events.
Slider Bandwidth Controller (`bandwidthvisualization/sliderBandwidthController.js`):
Retrieves the server hostname asynchronously.
Creates a noUiSlider instance for manual bandwidth adjustment.
Defines a range, step, tooltips, and formatting for the slider.
Listens for slider changes and updates the server with the new bandwidth value using a POST request.
Backend Script (`bandwidthvisualization/kubectl_get_all.py`):
Periodically retrieves the current bandwidth from the server using an API request.
Executes Docker commands for fetching status information from different containers (Boat and Edge).
Displays information about orchestrator status, bandwidth, Curl, Boat Cluster, and Edge Cluster status.
Utilizes the Rich library for console output formatting.
Retries on error and sleeps for 5 seconds between iterations.
Miscellaneous:
Uses various external libraries and dependencies, such as xterm.js, ECharts, Socket.IO, noUiSlider, Rich (Python library), and Express.
This project integrates a web-based terminal (xterm.js), real-time bandwidth visualization (ECharts), and manual bandwidth control through a slider. The server communicates with the client, updating the visualization and receiving input through WebSockets. The backend script periodically fetches information, orchestrates Docker commands, and displays formatted output in the console. This subproject provides a comprehensive solution for monitoring and controlling bandwidth network-related aspects.
Illustration: Bandwidth Visualization Embedded in Web Browser for IRISA Platform
Here are five figures that illustrate bandwidth visualization at various values, both in Auto mode and Manual mode:
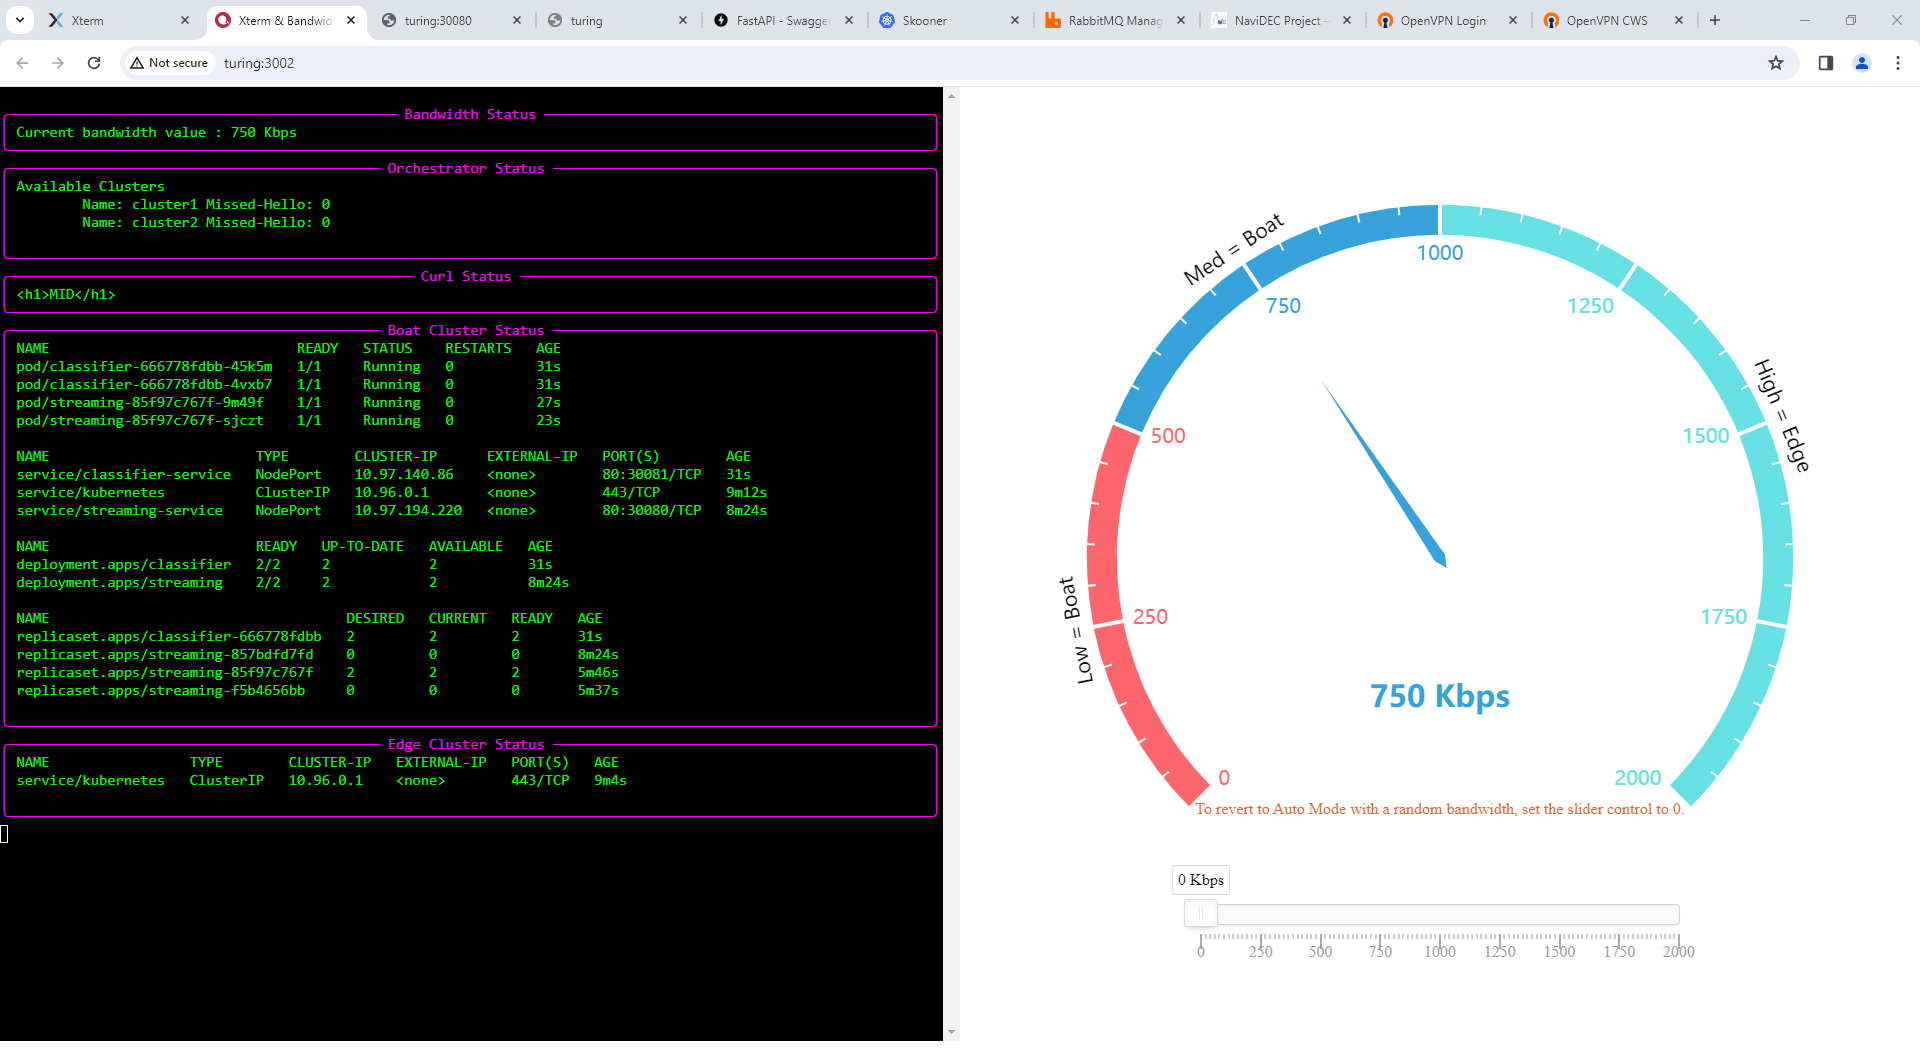
The illustrations showcases a web browser with an open tab directed to the server name, followed by its port address, specifically, http://turing:3002. The browser window is divided into two main sections:
Left Half - Web Terminal: Powered by xterm.js, this section displays several key components:
Bandwidth Status Section: Displays the current bandwidth value.
Orchestrator Status: Lists all active clusters, such as cluster1 and cluster2.
Curl Status: Shows the streaming tag according to the current bandwidth speed, categorized as BAD, MED, or GOOD bandwidth tag.
Boat Cluster Status: Displays both streaming and classifier resources when the bandwidth is low or medium, and only streaming when the bandwidth is high.
Edge Cluster Status: Displays only classifier resources when the bandwidth is high, and indicates no resources when the bandwidth is low or medium.
Right Half - Bandwidth Visualization and Controller: This section contains:
Bandwidth Gauge Visualization: Located at the top and powered by Apache ECharts, it represents the real-time bandwidth value. The gauge is color-coded into three categories:
Red: Indicates a low bandwidth range where the classifier resource will stay in 'Boat'.
Blue: Indicates a medium bandwidth range where the classifier resource will also stay in 'Boat'.
Turquoise: Indicates a high bandwidth range where the classifier resources will move to 'Edge'.
In all three color cases, the streaming resources are always located on the ‘Boat’ cluster1.
Slider Bandwidth Controller: Located at the bottom and powered by noUiSlider, it allows for changing the bandwidth value in Manual Mode for platform demonstration purposes. It operates as follows:
A value of 0 is the default and indicates Auto Mode, where the bandwidth visualization gauge will read from the Bandwidth Rotator API.
Any changed value will trigger Manual Mode, cancel reading from the Bandwidth Rotator API, and set the value from the slider Bandwidth Controller. This will update the bandwidth visualization gauge. The set value will remain unless it is changed to another value. Depending on whether the changed value is low, medium, or high, the classifier resource will either stay at 'Boat' or move to 'Edge'.
Returning to 0 will switch from Manual Mode back to Auto Mode to read the value from the Bandwidth Rotator API.
This structure provides a comprehensive overview of bandwidth visualization and its impact on classifier resources.

Display of Web Browser Bandwidth Visualization in Auto Mode Under Low Bandwidth Conditions.
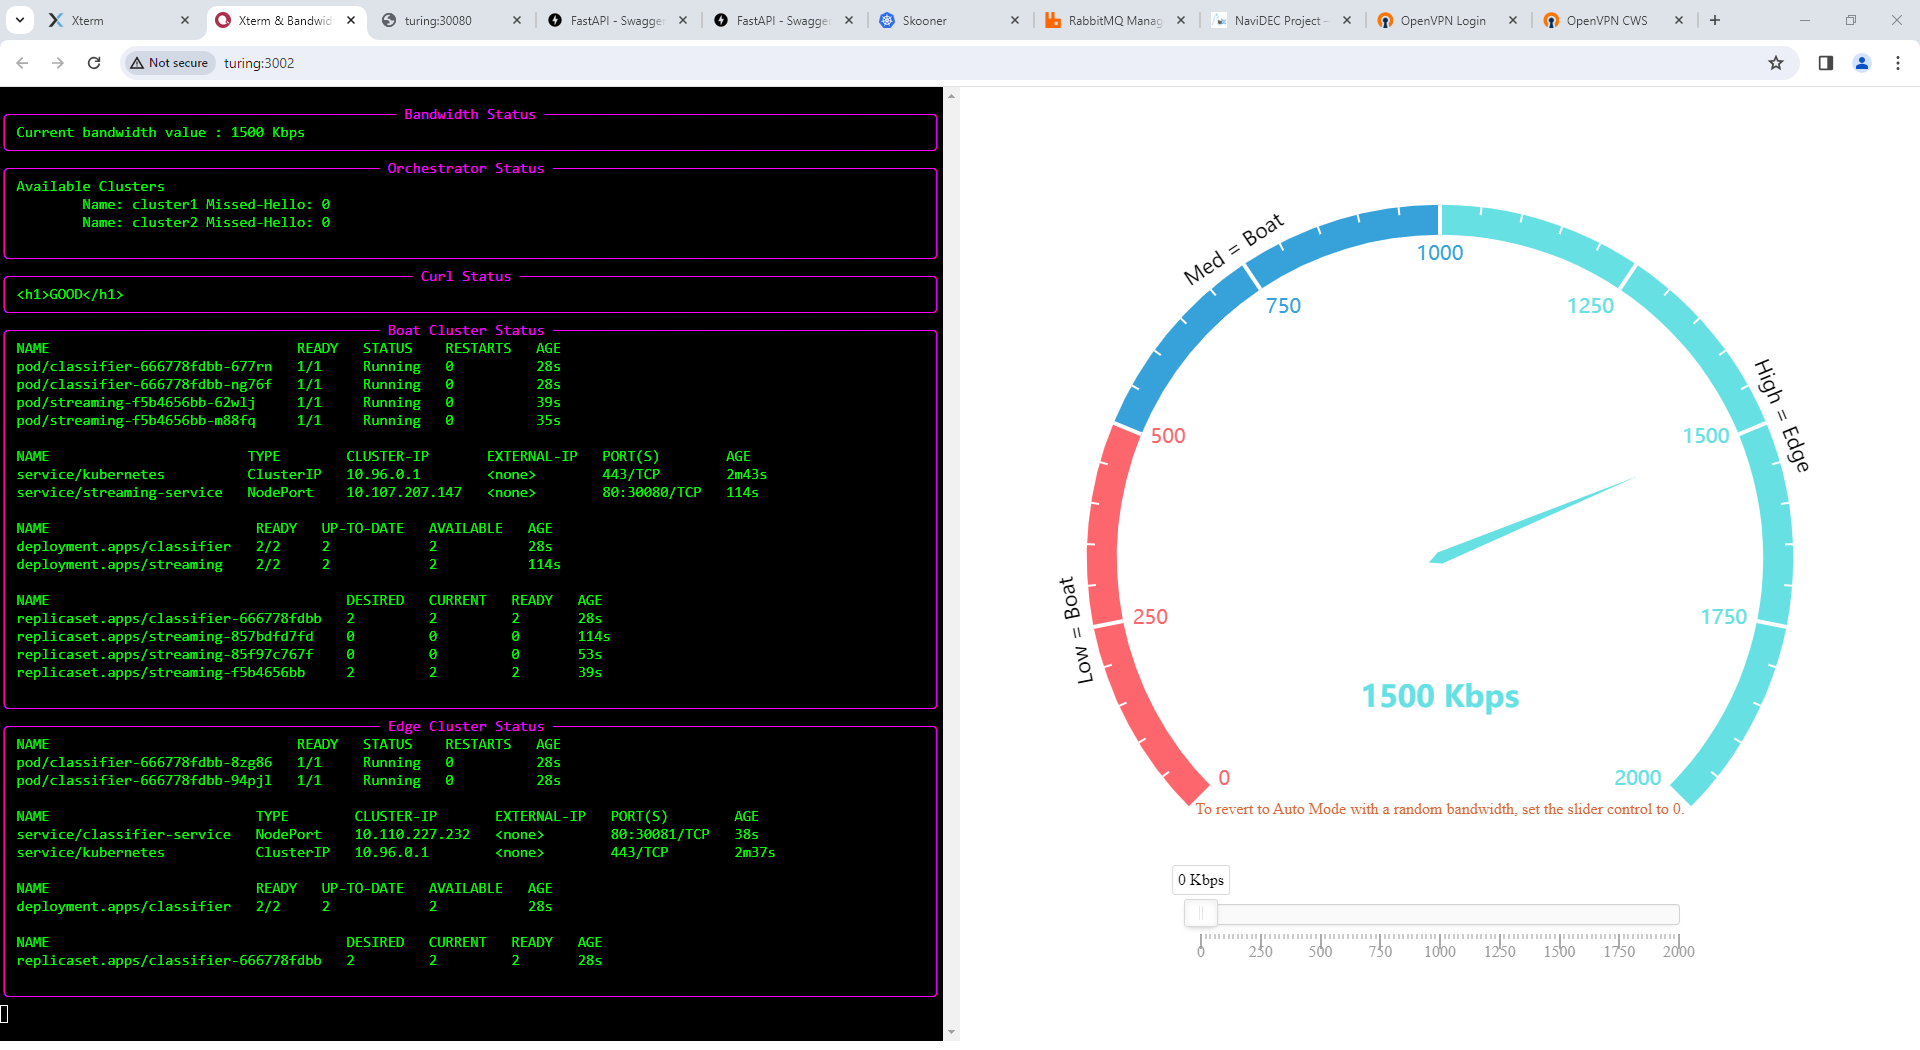
Display of Web Browser Bandwidth Visualization in Auto Mode Under High Bandwidth Conditions.
Display of Web Browser Bandwidth Visualization in Auto Mode Under Medium Bandwidth Conditions.
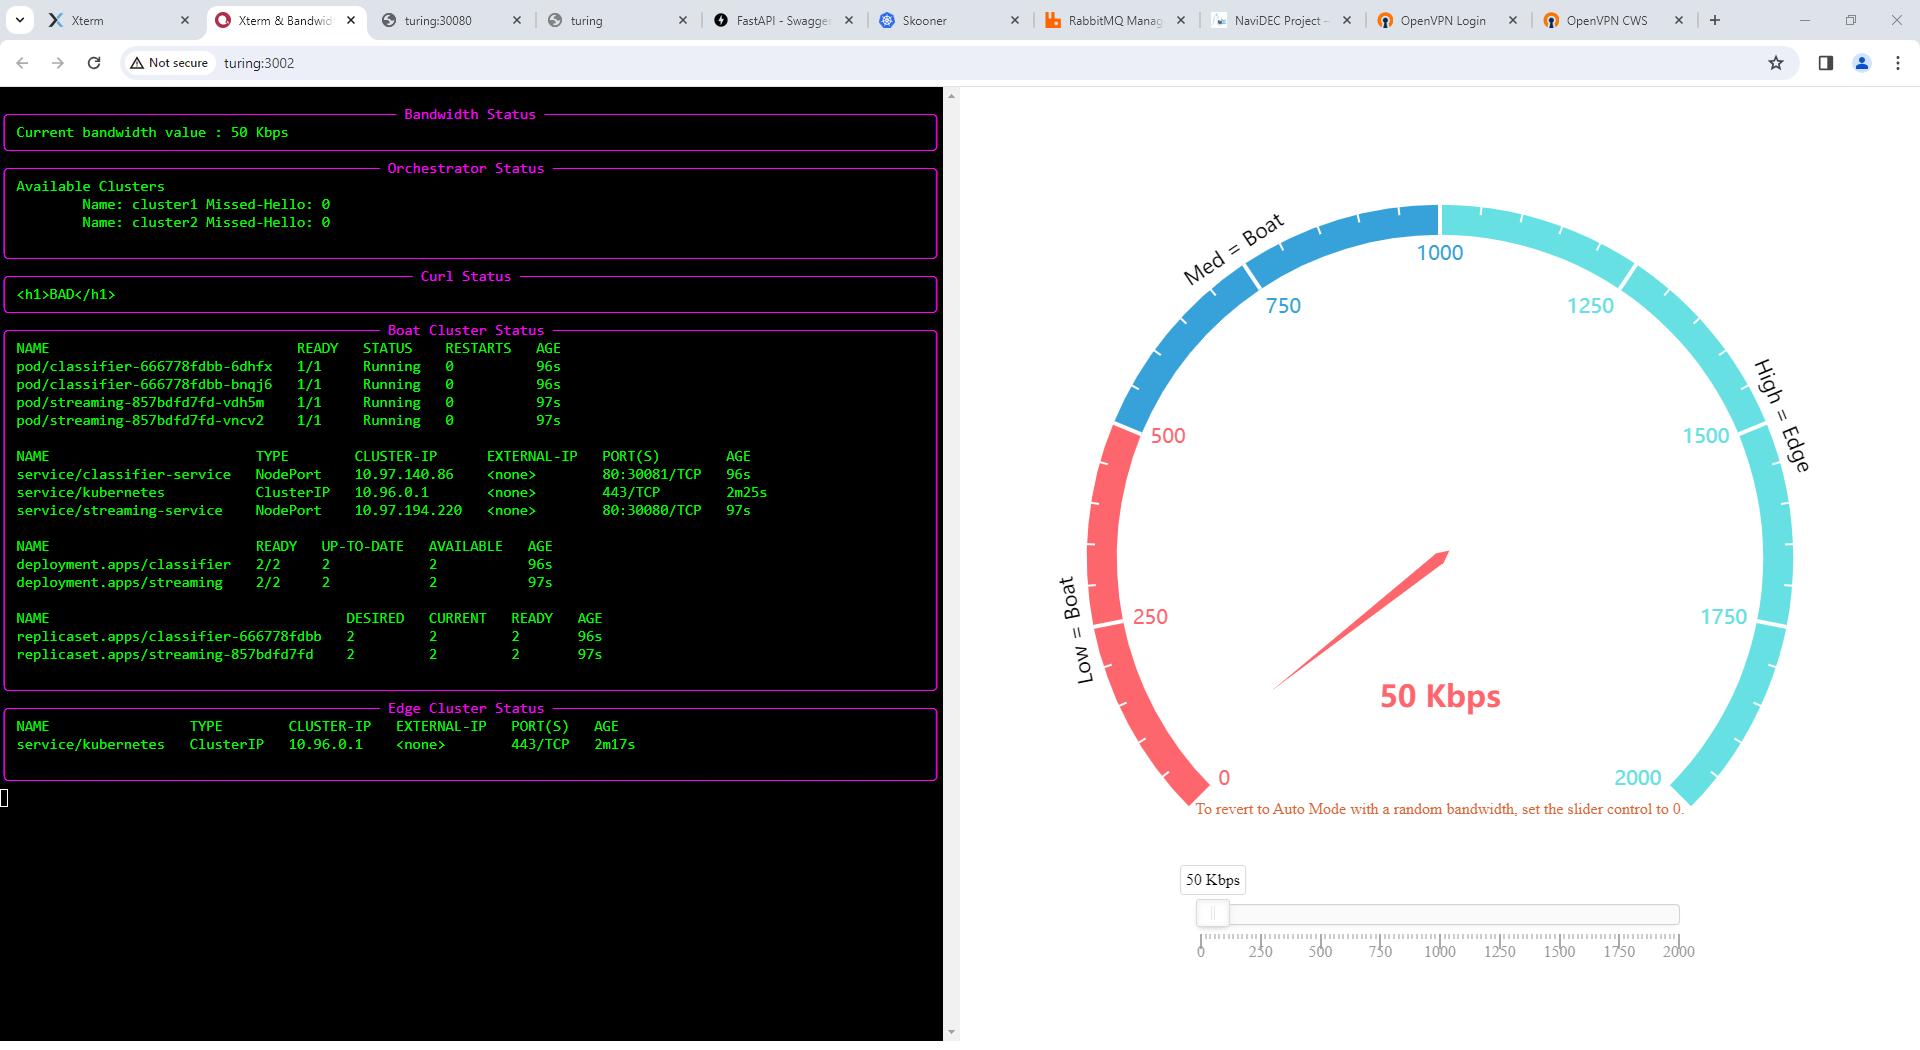
Display of Web Browser Bandwidth Visualization in Manual Mode Under Low Bandwidth Conditions.
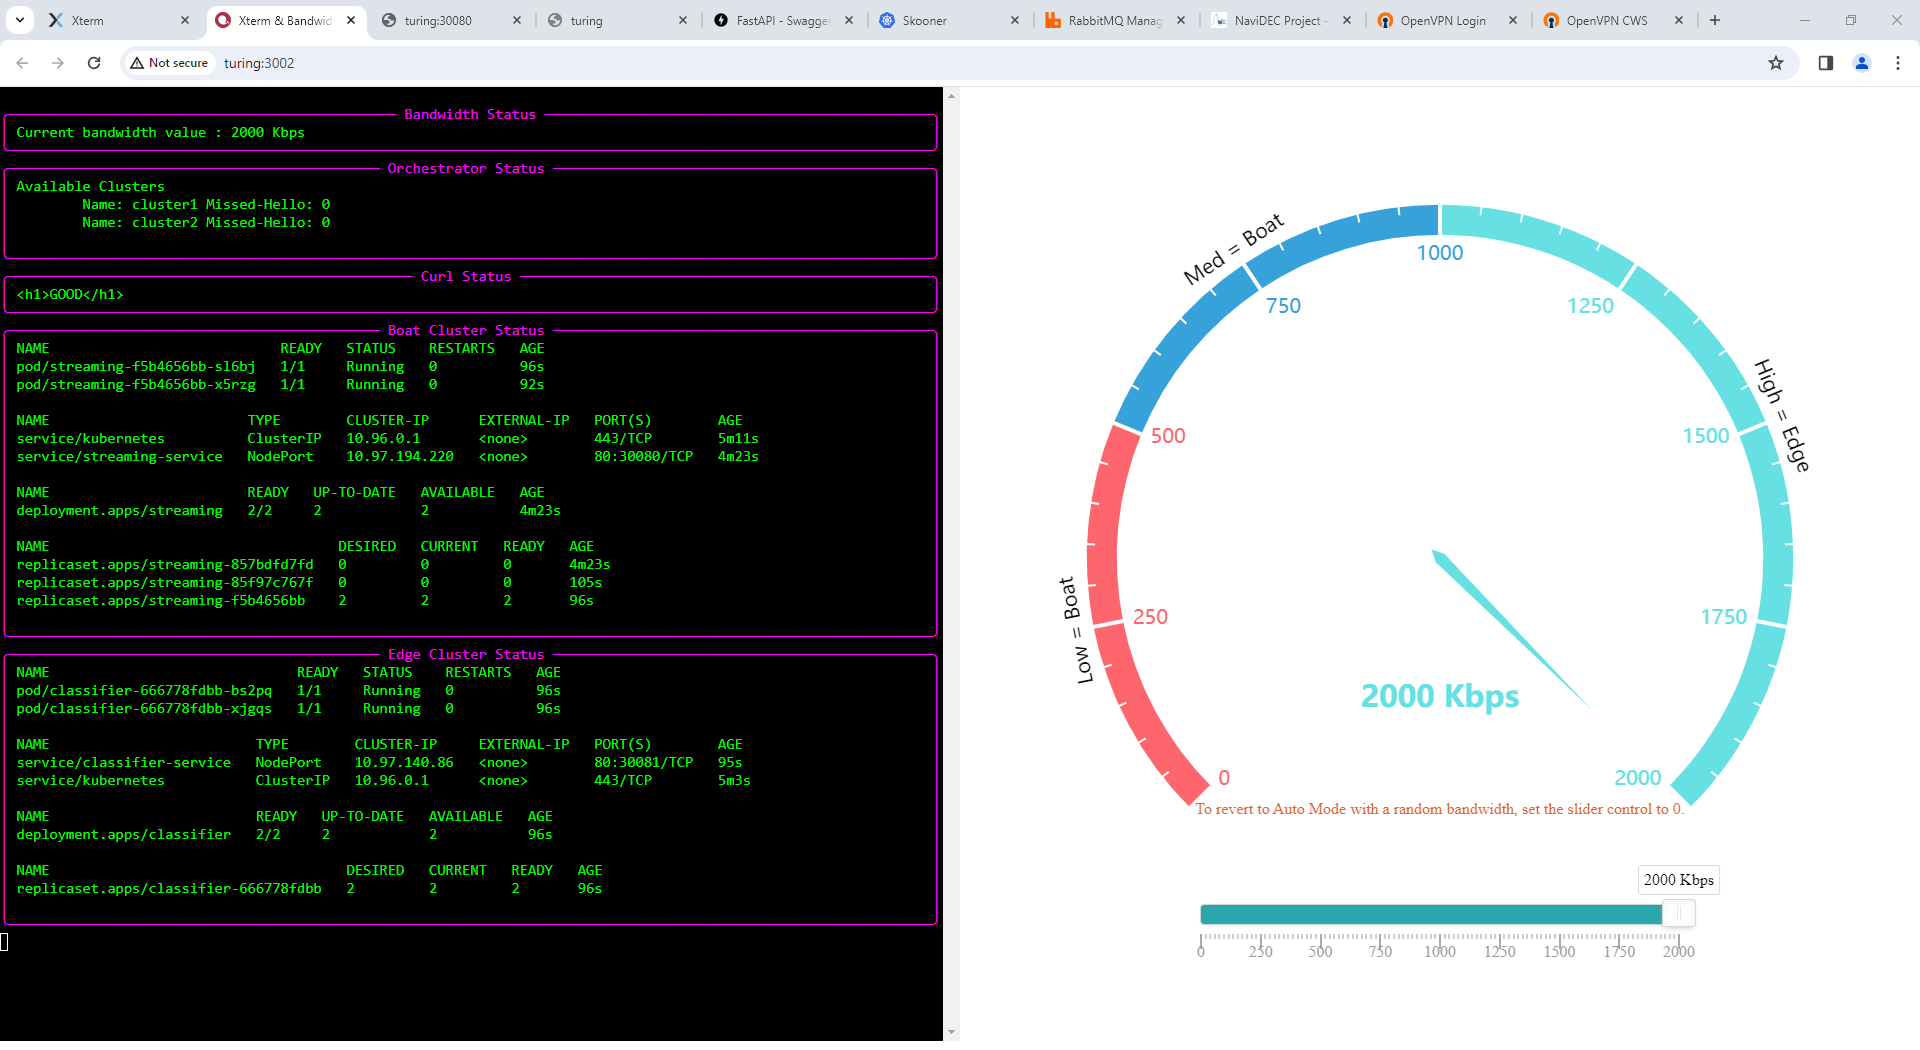
Display of Web Browser Bandwidth Visualization in Manual Mode Under High Bandwidth Conditions.
In summary
Apache ECharts offers a combination of open-source licensing, wide platform compatibility, extensive customization options, optimized performance for large-scale data visualization, and a growing community. These features make it a strong contender when choosing a charting library for IRISA Platform Project.
Code Repository
The source code for this subproject is available in the NaviDEC repository. This provides developers with the opportunity to explore, contribute to, and enhance the Bandwidth Visualisation basecode. You can access the repository at the following path: NaviDEC Repository.
Streamlined Integration of Skhooner Kubernetes Dashboard
Introduction: Enhancing Cluster Management with Skhooner
The IRISA Platform extends its capabilities by seamlessly incorporating the Skhooner Kubernetes Dashboard. This integration aims to provide a comprehensive solution for visual resource management within the Kubernetes cluster. The decision to adopt Skhooner aligns with the project's commitment to efficiency, user-friendliness, and streamlined cluster interaction.
Why Skooner?
In the original version of the IRISA Platform, Kubernetes Cluster Management could only be managed through the kubectl tool as a command-line interface or by using the NaviDEC REST API. These methods were not considered user-friendly for inexperienced end users. To enhance Cluster Management, Skooner was integrated.
Skooner lies at the core of the IRISA Platform, chosen for its ability to provide comprehensive cluster management, real-time updates, and health visualization. The decision to utilize Skooner aligns with the project's commitment to delivering a user-friendly and efficient Kubernetes management experience.
Benefits of Skooner in the IRISA Platform
Here are some benefits of using Skooner within the IRISA platform:
Full Cluster Management:
Skooner enables the management of various components of the cluster, including Namespaces, Nodes, Pods, Replica Sets, Deployments, Storage, and RBAC.
Real-Time Updates:
Skooner is always live, meaning there's no need to refresh pages to see the latest cluster status.
Health Visualization:
Real-time charts facilitate the quick identification of poorly performing resources and provide a visualization of cluster health at a glance.
Easy CRUD and Scaling:
Skooner provides inline API docs to easily understand what each field does.
In-Depth Examination of Skooner Integration in the IRISA Platform
Visual Resource Management:
Skhooner's intuitive dashboard offers a user-friendly interface for monitoring and controlling various components within the Kubernetes cluster. This visual resource management simplifies the understanding and oversight of cluster activities, enhancing the overall user experience.
Seamless Token Retrieval:
The dedicated function, skhooner_get_deployment_token, plays a crucial role in orchestrating the deployment of Skhooner within the IRISA Platform. This multifaceted function not only deploys Skhooner but also extracts the deployment token, ensuring secure access to the Kubernetes Dashboard within Docker containers. The extracted token is prominently displayed in the SSH terminal, providing users with immediate access. Additionally, the token is saved and accessible through the web browser console, found in the Xterm & Bandwidth Visualization tab of the IRISA Platform. Users can conveniently access this log by pressing F12 to open the browser console and navigating to the specified location. This integration enhances both security and accessibility, offering a streamlined and transparent experience for users interacting with the Kubernetes Dashboard.
Multiprocessing for Port Forwarding and Pod Readiness:
To optimize performance, a multiprocessing approach has been implemented for port forwarding and pod readiness checks. The PortForwardProcess efficiently manages the execution of kubectl port-forward commands for various components, ensuring smooth and dynamic integration.
Illustration: Skooner Dashboard Integration within IRISA Platform
This figure illustrates the Skooner Kubernetes Dashboard. On the left bar of this webpage, we can see the following sections: CLUSTER, WORKLOADS, SERVICES, REPLICAS, PODS, INGRESSES, CONFIG, STORAGE, ACCOUNTS, PROFILE, and APPLY. Each of these sections provides extensive information about the related elements. The 'Apply' section can be used to deploy a deployment or service as a YAML file. In the middle of the webpage, we can see the number of WORKLOADS and PODS. We can also see the names of deployments, such as 'classifier' and 'streaming', along with their related namespaces.
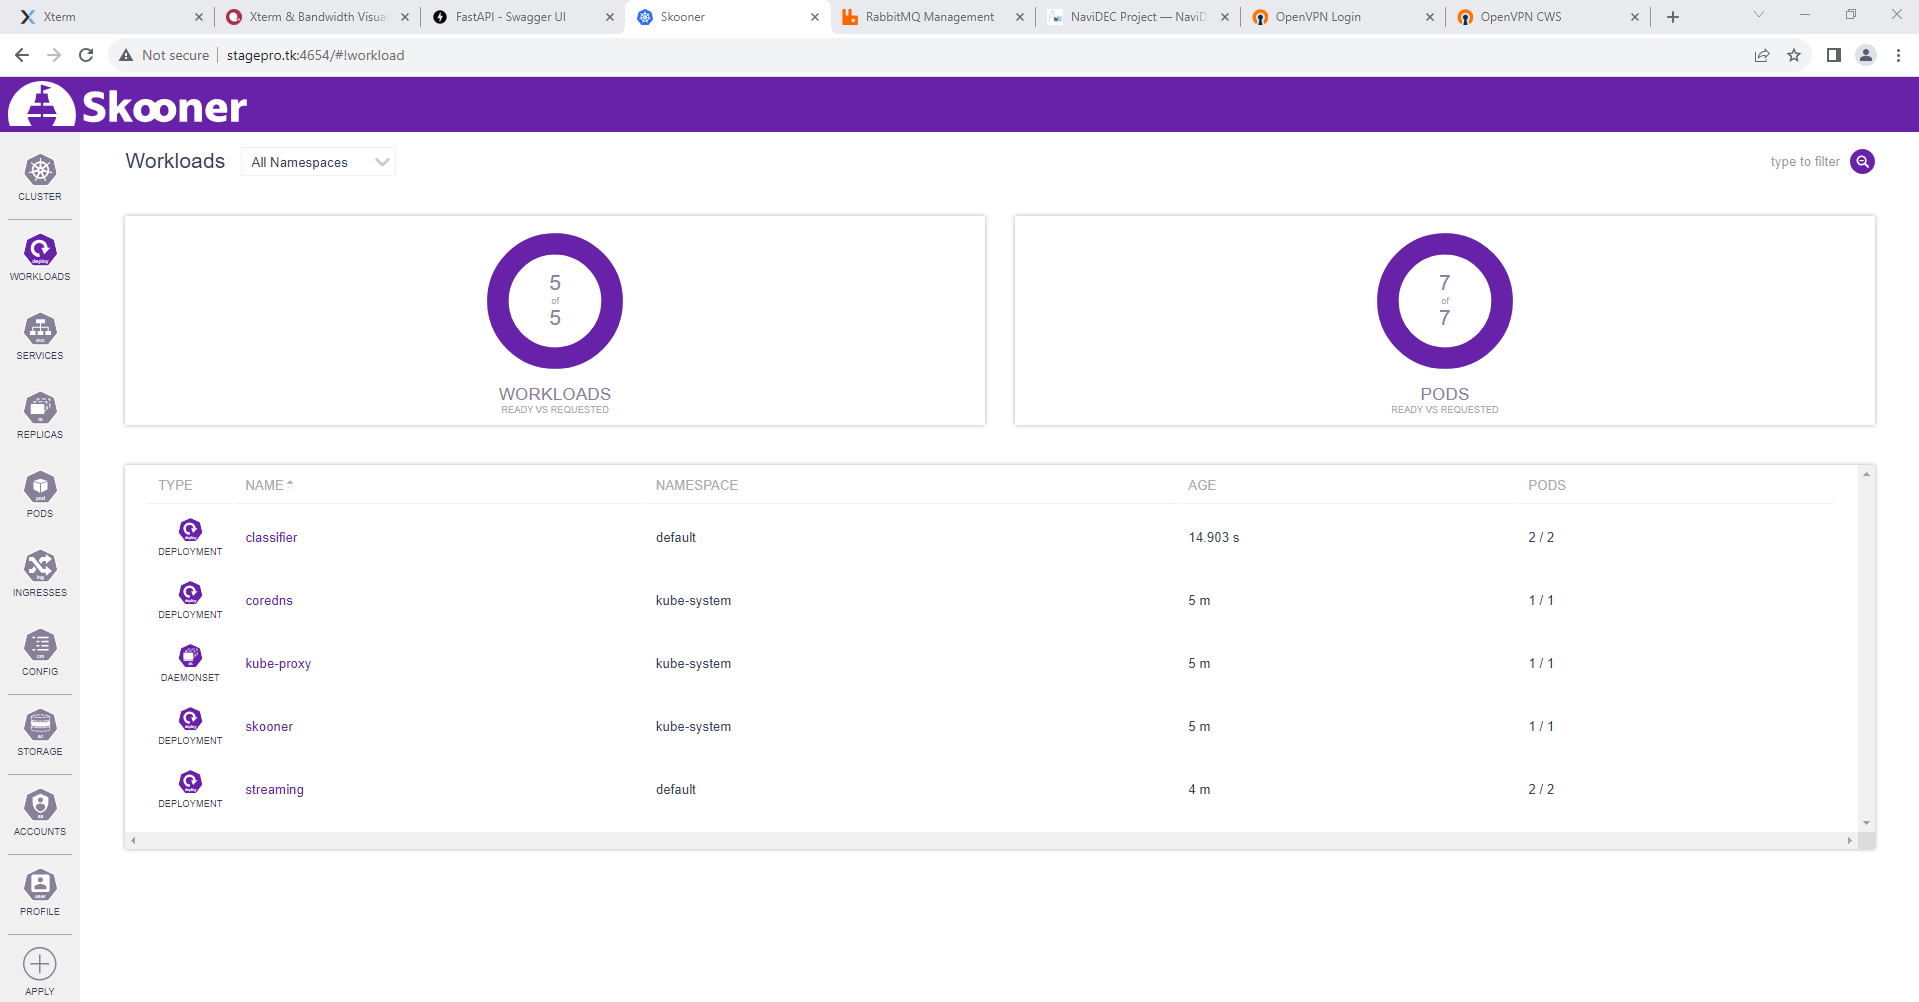
Overview of the Skooner Kubernetes Dashboard User Interface for Boat, referred to as Cluster1.
In Summary
The integration of the Skhooner Kubernetes Dashboard enhances the IRISA Platform's cluster management capabilities. Developers and users can leverage Skhooner's visual resource management, simplified token retrieval, and multiprocessing functionalities to achieve a more efficient and user-friendly Kubernetes cluster interaction. The project's commitment to innovation and practical solutions is further by the seamless incorporation of Skhooner.
Code Repository
For more details, Click here to view the skooner integration basecode.
Enhanced Framework Migration: Flask to FastAPI
Introduction: Elevating Performance and Functionality with FastAPI
The IRISA Platform undergoes a transformative framework migration, transitioning from Flask to FastAPI. This strategic move is motivated by a desire to elevate project performance, embrace modern architecture, automate API documentation, and improve error handling.
Why FastAPI?
The decision to adopt FastAPI as the new framework for the IRISA Platform is rooted in its automatic API documentation generation witch not automatically availabe in Flask.
Benefits of FastAPI within IRISA Platform
Here are some benefits of using FastAPI within IRISA platform:
Automated API Documentation:
One of the distinguishing features of FastAPI is its capability to automatically produce detailed API documentation. This feature allows developers to interact with the API, even without any pre-existing UI code. It offers developers a clear understanding of the available endpoints and functionalities, thereby simplifying the development workflow.
To access the auto-generated documentation, navigation to the /docs or /redoc endpoint is required. This presents the Swagger UI, enabling testing of the API endpoints and displaying all the endpoints defined in the application.
This feature sets FastAPI apart from frameworks like Flask, lacking this automatic documentation generation. While Flask does support documentation, it requires manual setup, which can be seen as a disadvantage.
Optimal Speed:
FastAPI is renowned for its exceptional speed, making it one of the fastest Python frameworks. For performance comparisons and more information, please refer to the official FastAPI documentation on performance.
In-Depth Examination of FastAPI migration in the IRISA Platform
Following the migration to the FastAPI framework, there has been an emphasis on enhancing the code for better error handling. Functions have been developed by a dedicated individual to automate the launch process, among numerous other improvements. A comprehensive overview of these enhancements can be found in the following code repository section.
The focus is on the newly developed BandwidthRotator API, which replaces the previous method of manually updating bandwidth values via a JSON file. The BandwidthRotator class, along with its associated API endpoints, allows for real-time management and updating of bandwidth settings using FastAPI and Socket.IO. Let's delve into the key components:
BandwidthRotator Class:
Initialization:
self.bandwidth_values: A list containing predefined bandwidth values.
self.current_bandwidth_index: Initialized to the last index of self.bandwidth_values.
self.shutdown_flag: An asyncio.Event to signal the shutdown of the bandwidth rotation task.
self.manual_mode: A flag indicating whether the bandwidth rotation is in manual mode.
self.background_task: An asyncio task that initiates the rotate_bandwidth method.
rotate_bandwidth Method:
An asynchronous method that continuously rotates bandwidth values based on a timer.
If not in manual mode, it updates the bandwidth index and emits the new bandwidth value to connected clients using Socket.IO.
Runs in the background until the shutdown_flag is set.
stop_rotating_bandwidth Method:
Stops the bandwidth rotation by setting the shutdown_flag.
get_current_bandwidth Method:
Returns the current bandwidth value based on the current index.
set_bandwidth Method:
Accepts a new bandwidth value.
If the value is "0," it sets the rotator to automatic mode, immediately rotates to the next bandwidth value, and emits the update.
Otherwise, it sets manual mode, updates the bandwidth value, and emits the update.
FastAPI Endpoints:
GET /bandwidth:
Returns the current bandwidth value as a JSON response.
Uses the Depends function to inject the current bandwidth value from the BandwidthRotator class.
POST /bandwidth:
Accepts a new bandwidth value through the request.
Updates the bandwidth value in the BandwidthRotator class and emits the update.
Returns a JSON response indicating successful bandwidth update.
Shutdown Event:
Defines an asynchronous event handler for the FastAPI app shutdown event.
Calls the stop_rotating_bandwidth method to stop the bandwidth rotation task.
Signal Handling:
Defines a signal handler function (handle_shutdown_signals) to handle SIGINT and SIGTERM signals.
Calls stop_rotating_bandwidth on receiving signals to initiate a graceful shutdown.
Socket.IO Event:
Defines a Socket.IO event handler for client connection (connect).
Emits the current bandwidth value to the connected client.
Initialization:
Initializes the BandwidthRotator class (bandwidth_rotator) on FastAPI app startup.
Registers the stop_rotating_bandwidth method for the app shutdown event.
Registers signal handlers for graceful shutdown on SIGINT and SIGTERM.
Overall, this implementation provides a flexible mechanism to dynamically update and rotate bandwidth values in real-time, with support for both automatic and manual modes. Clients connected via Socket.IO receive updates whenever the bandwidth values change. The implementation ensures proper cleanup and shutdown handling.
Illustration: FastAPI automated API docs UI within IRISA Platform
This figure provides an overview of the FastAPI Swagger User Interface for Boat, also known as Cluster1. The interface is designed to handle a variety of requests, including but not limited to GET, POST, and DELETE operations. Each request is associated with a specific endpoint such as 'index', 'nodes', 'resources', 'deployments', 'services', 'pods', and 'bandwidth'. These endpoints serve as gateways for interacting with diverse facets of the system, thereby offering a robust toolset for effective cluster management and monitoring.
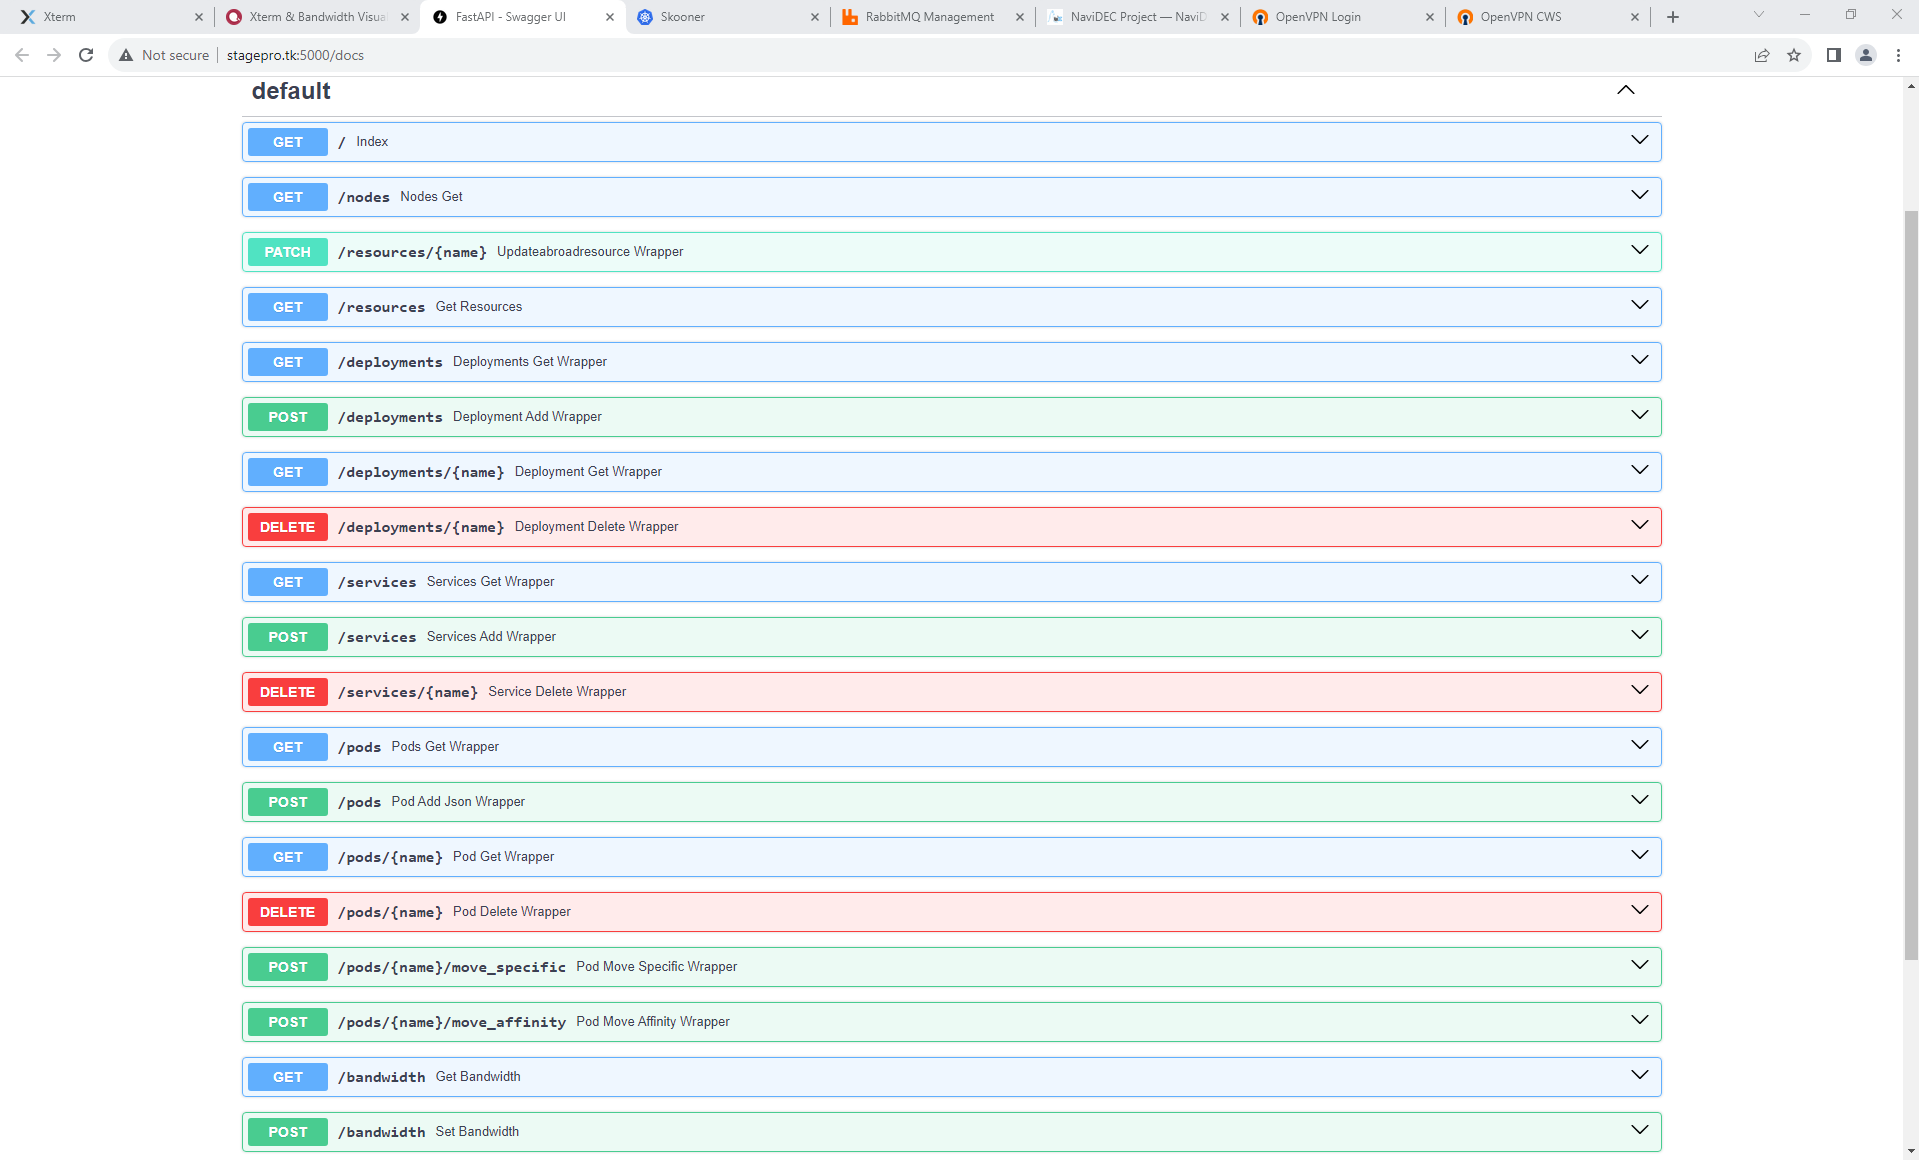
Display of FastAPI Swagger User Interface for Boat, referred to as Cluster1.
In Summary
The transition from Flask to FastAPI in the IRISA Platform represents a strategic move to achieve optimal performance and automate API documentation. These advancements contribute to a more efficient, reliable, and developer-friendly environment.
Code Repository
For more details, Click here to view the FastAPI framework basecode.
Comprehensive Logging System
Introduction: Comprehensive Logging System Overview
The logger.py script within the IRISA Platform embodies a comprehensive logging system, designed to enhance visibility, traceability, and error monitoring across the platform. This section provides an in-depth overview of the logging system, its rationale, and its pivotal role in the IRISA Platform.
Why Logging Matters ?
In the dynamic and intricate landscape of the IRISA Platform, a robust logging system is indispensable. The logger.py script serves as the linchpin for this system, offering a structured approach to capturing critical events, diagnostics, and information flow within the platform. Logging, in this context, goes beyond mere error tracking; it becomes a strategic tool for understanding the platform's behavior, identifying potential improvements, and fostering a proactive approach to system maintenance.
Benefits of Using Logging system within IRISA Platform
Here are some benefits of using Logging system within the IRISA platform:
Visibility and Traceability:
The IRISA platform comprises multiple components distributed across clusters. Logging ensures visibility into the activities of each component, allowing developers and administrators to trace the flow of information, understand interactions, and identify potential bottlenecks.
Error Detection and Diagnosis:
Comprehensive logging is instrumental in detecting errors and diagnosing issues promptly. The structured logs generated by logger.py provide contextual information about the environment, facilitating a quicker and more accurate diagnosis of problems.
Performance Monitoring:
Monitoring the platform's performance is a critical aspect of ensuring optimal functionality. The logging system captures timestamps, cluster identifiers, and other relevant data, enabling the monitoring of response times, resource utilization, and overall system health.
Centralized Log Storage:
The logger.py script facilitates centralized log storage by creating a log file (navidec_logger.log). This centralized approach streamlines log analysis, troubleshooting, and monitoring across the entire NaviDEC ecosystem.
Cluster Identification:
The logging system incorporates a cluster identification mechanism, associating each log entry with a specific cluster. This feature is vital in a multi-cluster environment, providing context to logs and aiding in the isolation of issues to specific clusters.
Configurable Logging:
The logging system is configurable, allowing developers to control the verbosity of logs. By toggling the logging_enabled variable, users can seamlessly switch between detailed logging for debugging and minimal logging for production environments.
In-Depth Examination of Logger.py Script within IRISA Platform
The logger.py script encapsulates the logging functionalities within the IRISA Platform. It provides a flexible and configurable logging framework that aligns with the project’s goals of visibility, diagnostics, and proactive maintenance.
The script allows users to control the logging level, which can be set to any valid logging level such as INFO, DEBUG, WARNING, ERROR, CRITICAL, etc. This provides flexibility in choosing between detailed logging for development and minimal logging for production.
By default, all logs are written to a file named NaviDEC_logger.log, without being displayed on the console. This approach is designed to keep the console output clean and free from potentially distracting log messages, enhancing the user experience.
Each time the IRISA platform runs, it generates a new log file, ensuring that log data is always up-to-date and relevant.
Here’s a breakdown of the key components of the logger.py script:
Cluster Identification:
The script maps hostnames to cluster identifiers, ensuring that each log entry is tagged with the relevant cluster information.
Logger Initialization:
The get_logger function initializes the logger, setting up the necessary configurations based on the provided name and logging status.
Logging Format:
A structured logging format is defined, incorporating timestamp, cluster identifier, logger name, log level, and the log message. This format enhances readability and facilitates log analysis.
File Handler:
If logging is enabled, the script creates a file handler, directing logs to a central log file (navidec_logger.log). This file serves as a consolidated repository for logs across different components.
Log Level Control:
The script allows users to control the logging level, providing flexibility in choosing between detailed logging for development and minimal logging for production.
Log Functionality:
The script includes a function (get_current_date) that generates and logs the current date. This serves as an example of a loggable action within the IRISA Platform.
Compatibility with Grafana Loki Logging System:
The logs generated by the logger.py script can be scraped and visualized using the Grafana Loki logging system. This compatibility enhances the monitoring capabilities of the IRISA Platform, allowing for efficient log aggregation, exploration, and analysis.
In this way, the logger.py script becomes an integral part of the IRISA Platform, providing a flexible and configurable logging framework that aligns with the project's goals of visibility, diagnostics, and proactive maintenance.
Illustration: Showcasing the process of log entries being written to the NaviDEC_logger.log file
Here are two figures that illustrate Sample of the NaviDEC_logger.log file, showcasing its content and structure at the beginning and at the end of the file
The sample_navidec_logger.log entries follow a structured format with specific information logged for each entry. Here's an analysis of the structure:
Timestamp:
Format: YYYY-MM-DD HH:mm:ss,sss
Example: 2023-12-01 19:56:33,240
Location (Device/Cluster):
Example: cluster1
Indicates the device or cluster from which the log entry originates.
File Name:
Example: scripts.config, main, scripts.utils
Specifies the name of the file containing the code that generated the log entry.
Logger Type:
Example: INFO
Specifies the type of logger event, such as INFO.
Log Message:
Example: channel: Setting up channel..., Initializing FastAPI: APIs for cluster cluster1 listening on 10.0.0.251:5000. Cluster positioned on the deep-edge
Contains the actual log message describing the activity or event.

Sample of the NaviDEC_logger.log file, showcasing its content and structure at the beginning of the file.
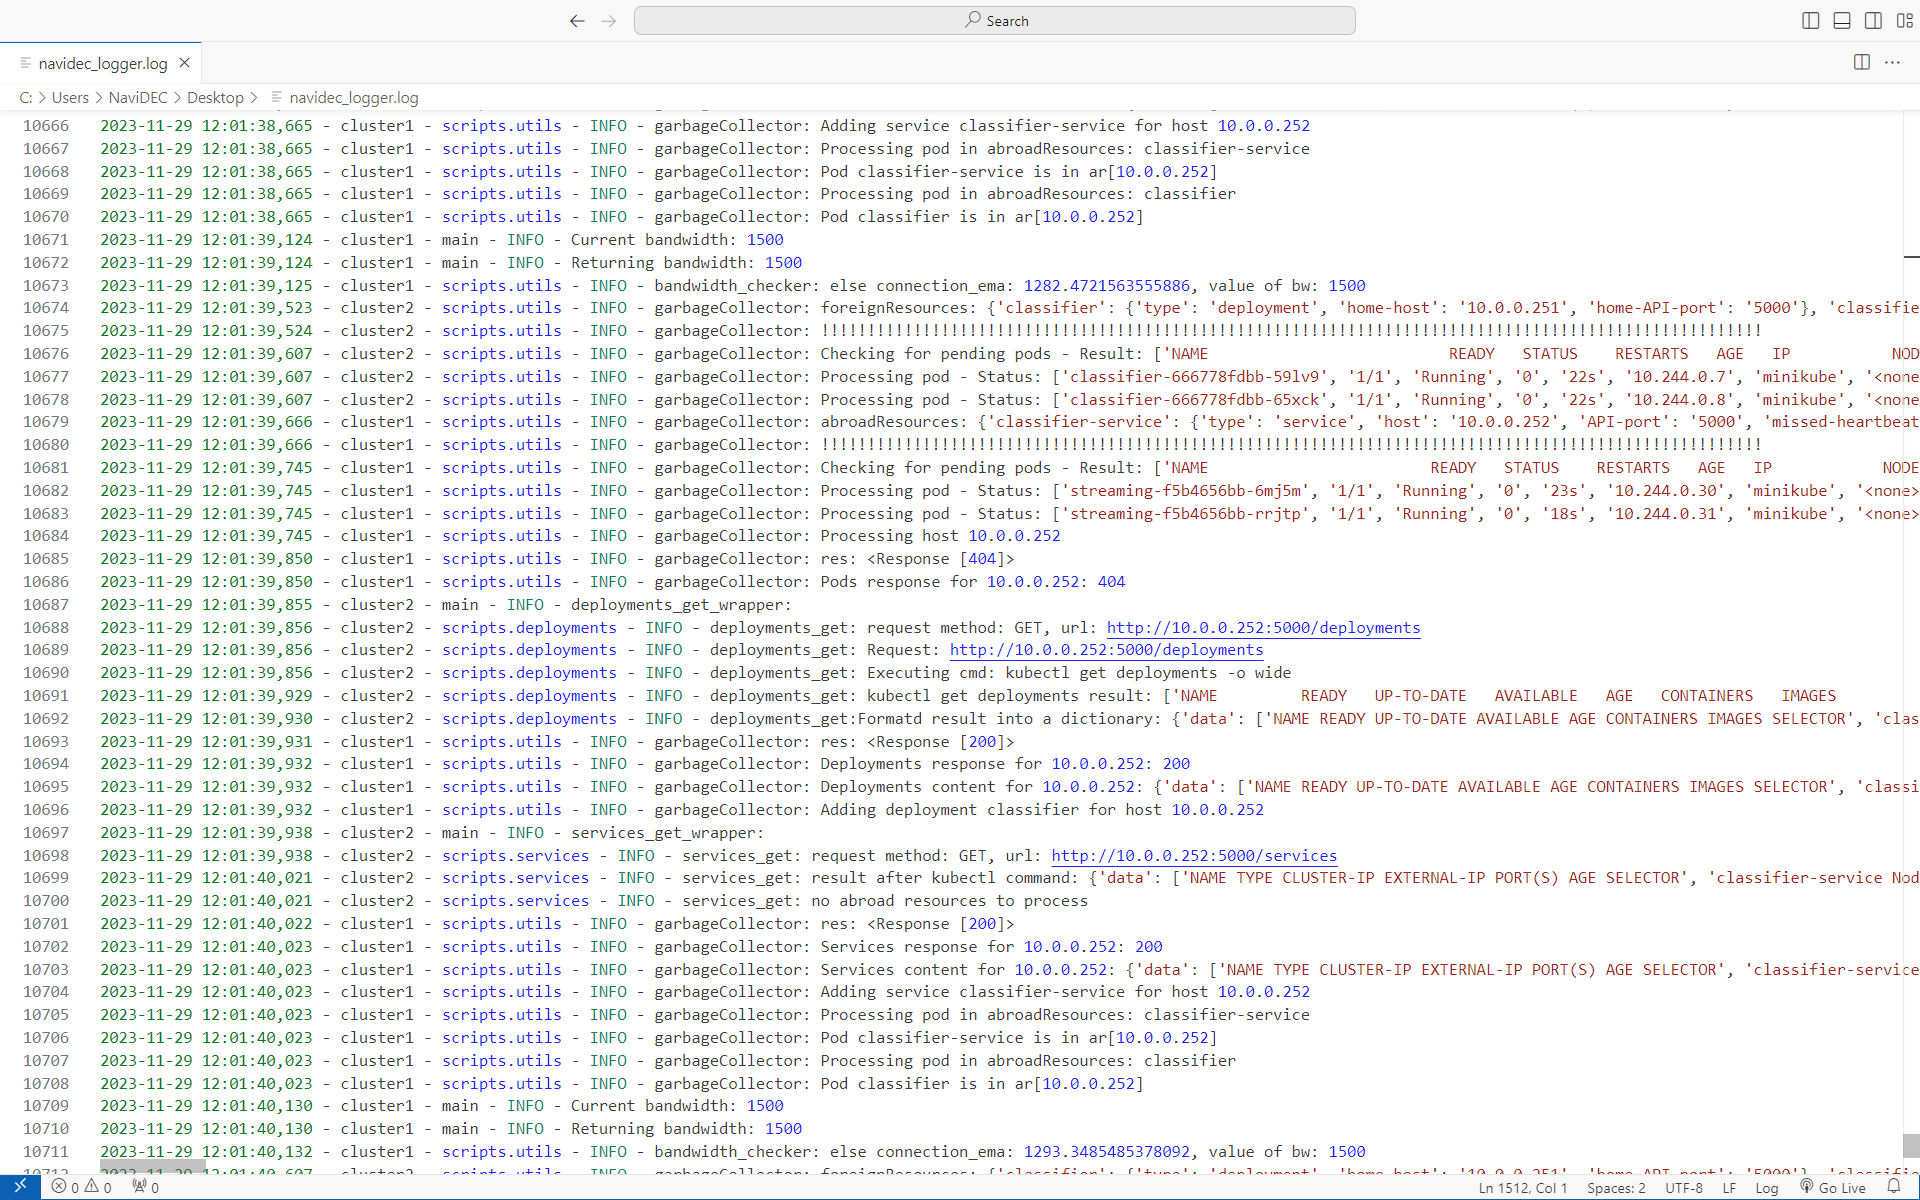
Sample of the NaviDEC_logger.log file, showcasing its content and structure at the end of the file.
In summary
Each log line in the file has the following structure:
Timestamp - Location - File Name - Logger Type - Log Message
Code Repository
For more details, Click here to view the logger.py source code.
Diagram Illustration, Enhancing Code Comprehension and Logical Visualization
Introduction: Visualizing the Logic and Flow of the IRISA platform
In the intricate world of software development, the IRISA Platform places a strong emphasis on enhancing code comprehension and logical visualization. This section explores the utilization of diagrams to illustrate the underlying logic and flow of the IRISA platform's architecture. By adopting visual aids, developers can gain a deeper understanding of the system, facilitating collaboration, troubleshooting, and seamless contribution to the codebase.
Why Diagrams ?
The incorporation of diagrams into the IRISA Platform serves multiple purposes, offering developers a visual representation of the platform's architecture, relationships between components, and the flow of data and processes. The advantages include:
Code Comprehension:
Diagrams provide a high-level overview of the codebase, making it easier for developers to grasp complex relationships and interactions between different modules and components.
Logic Visualization:
Flowcharts and architectural diagrams visualize the logical pathways and data flow within the IRISA platform, aiding developers in understanding the system's behavior.
Collaborative Development:
Visual representations act as a common ground for developers, enabling effective collaboration by providing a shared understanding of the codebase and architecture.
Onboarding and Training:
New developers joining the project can quickly familiarize themselves with the codebase and architecture through visual diagrams, expediting the onboarding process.
Troubleshooting:
When debugging or troubleshooting, developers can refer to diagrams to identify potential points of failure, bottlenecks, or areas requiring optimization.
Benefits of Diagrams for IRISA Platform
Here are some benefits of using Diagrams for IRISA platform:
Enhanced Code Comprehension:
Visualizing code through diagrams enhances overall comprehension, allowing developers to see the bigger picture and understand the interplay of different components.
Efficient Communication:
Diagrams provide a concise and efficient means of communication, reducing the complexity of conveying intricate architectural details during discussions or code reviews.
Improved Decision-Making:
Visual aids aid in decision-making processes by presenting a clear representation of architectural choices, dependencies, and their implications.
Documentation Enhancement:
Incorporating diagrams into documentation enriches it, making it more accessible and engaging for developers seeking insights into the platform's architecture.
Types of Diagrams for IRISA Platform
NaviDEC project Overview:
Provides a high-level view of NaviDEC project, focusing on its objectives, stakeholders, and key deliverables, without delving into technical specifics.
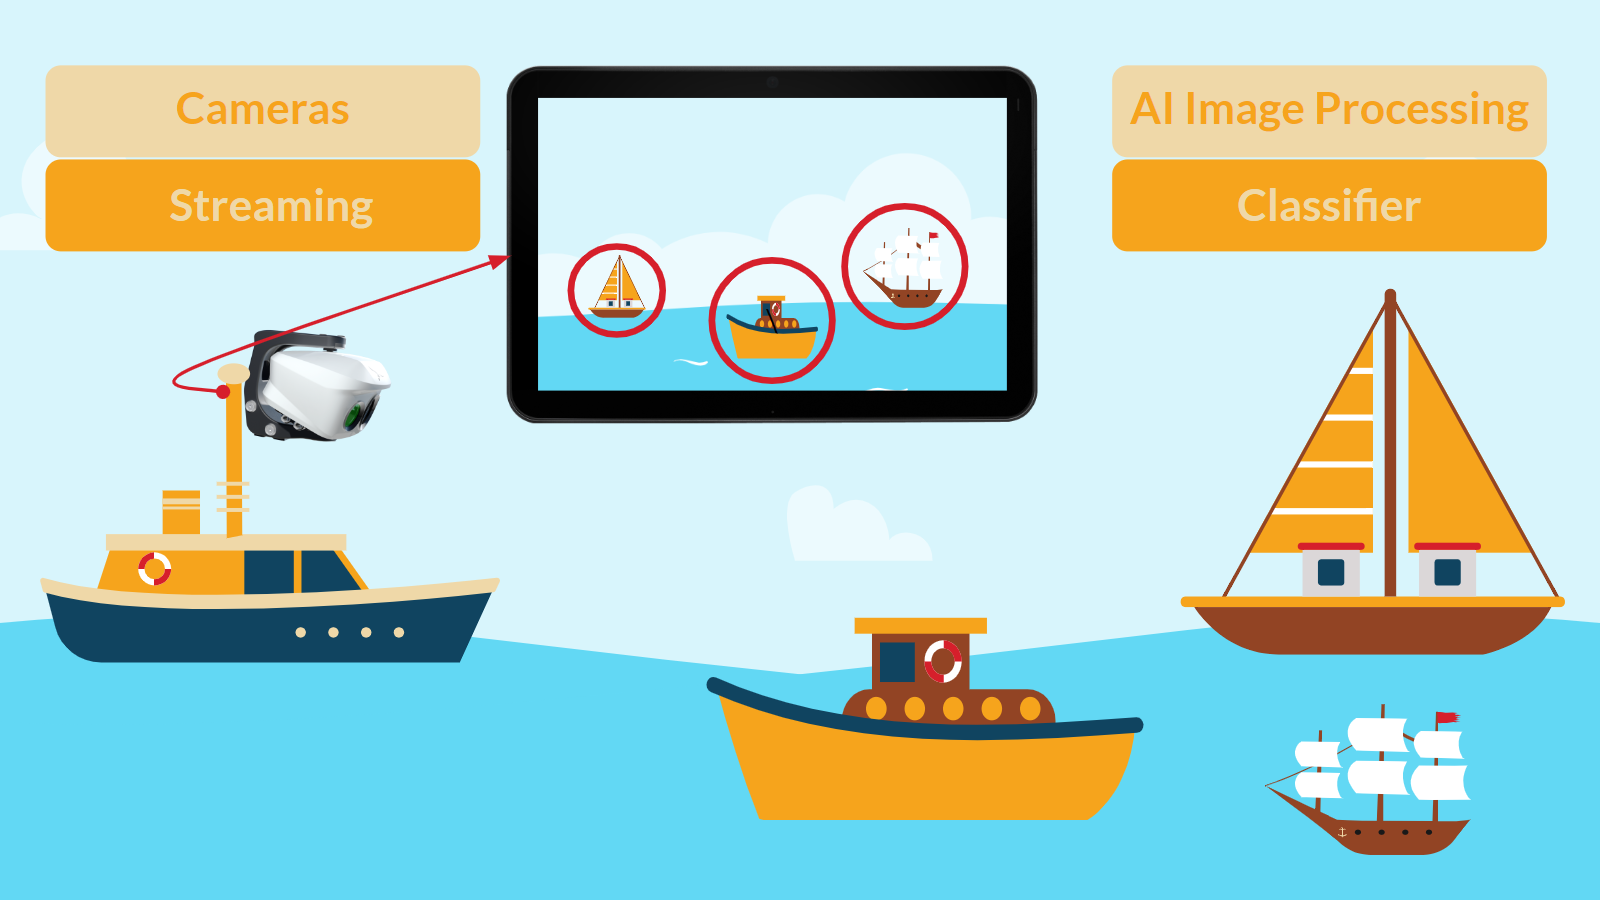
Display of NaviDEC Work Context.
The NaviDEC use-case is currently operating at a low LTE bandwidth status.
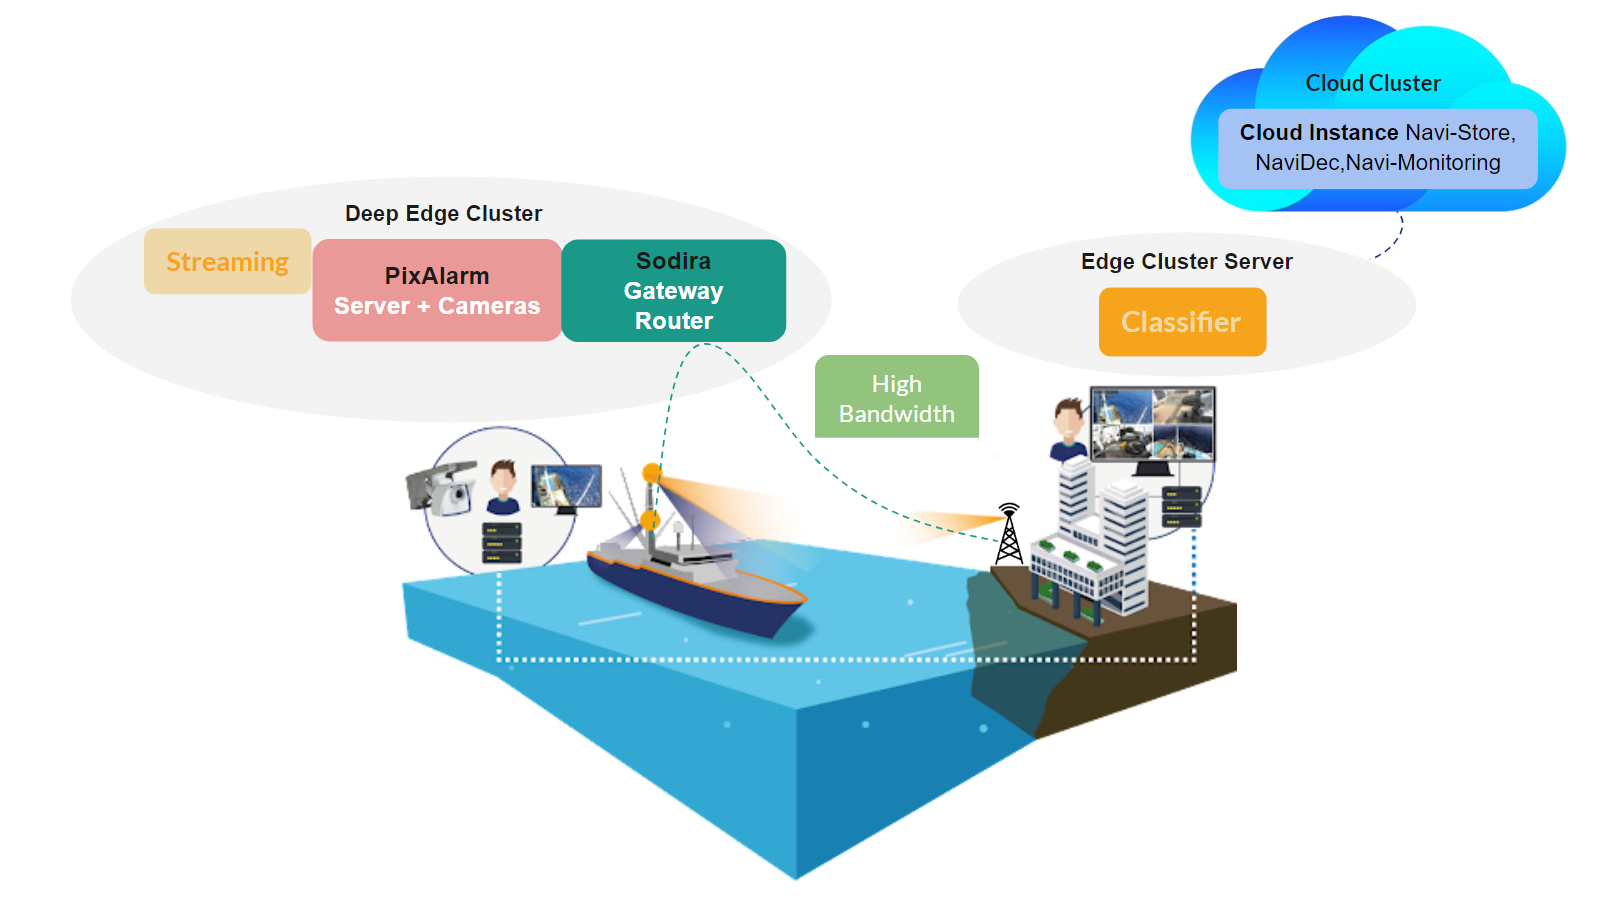
The NaviDEC use-case is currently operating at a high LTE bandwidth status.
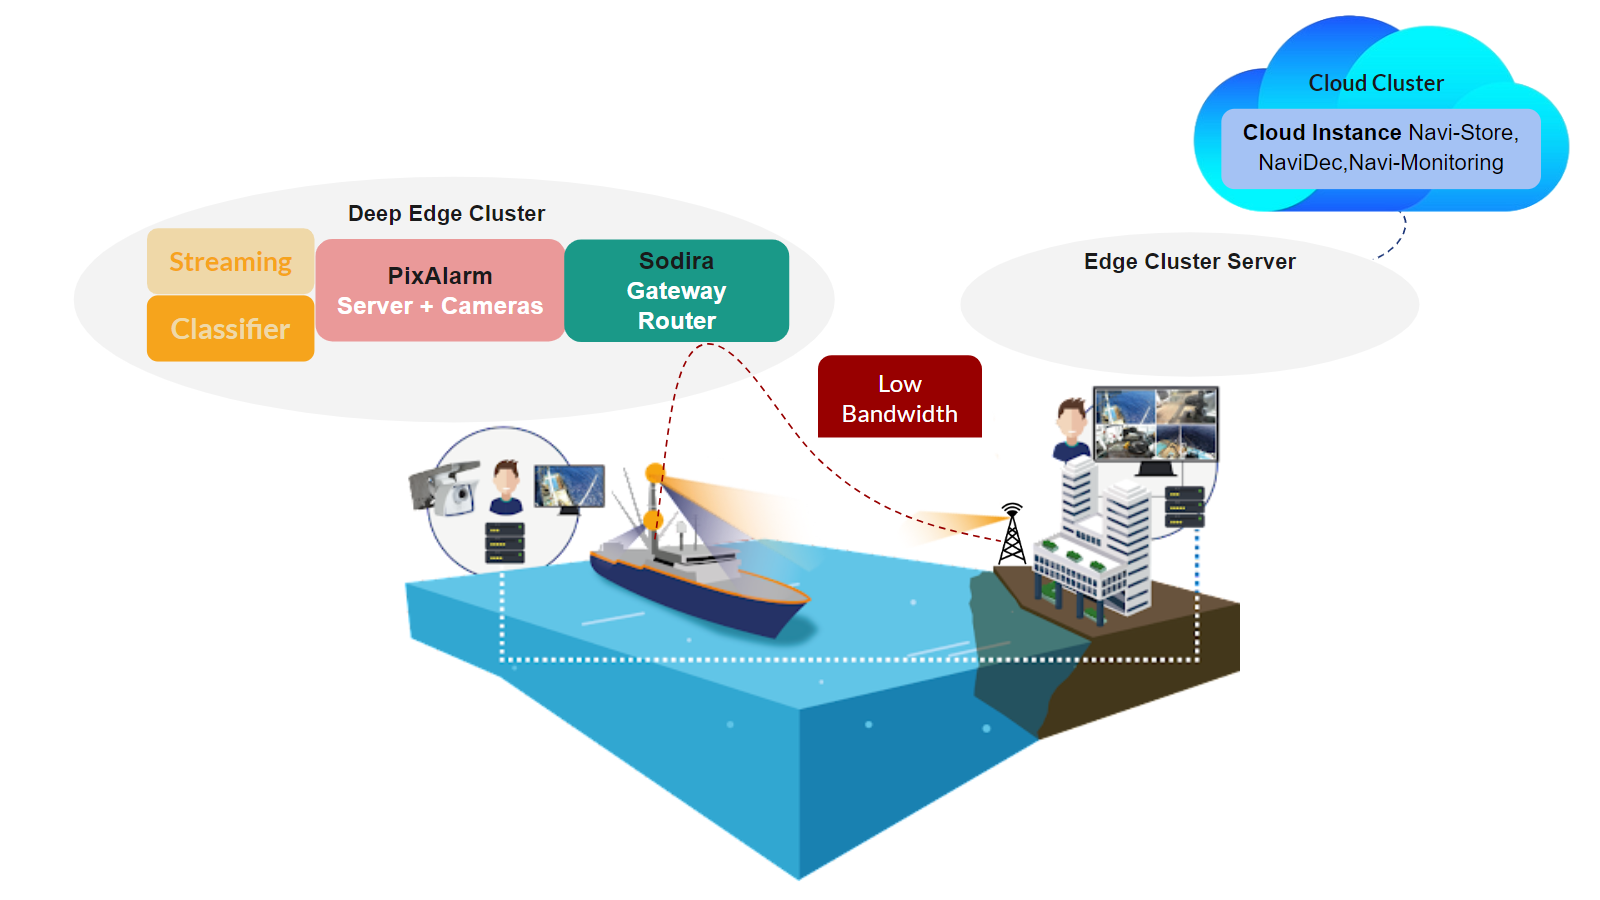
Platform Architecture Diagram:
Illustrates the overall structure of the IRISA platform, including the relationships and dependencies between its various components.
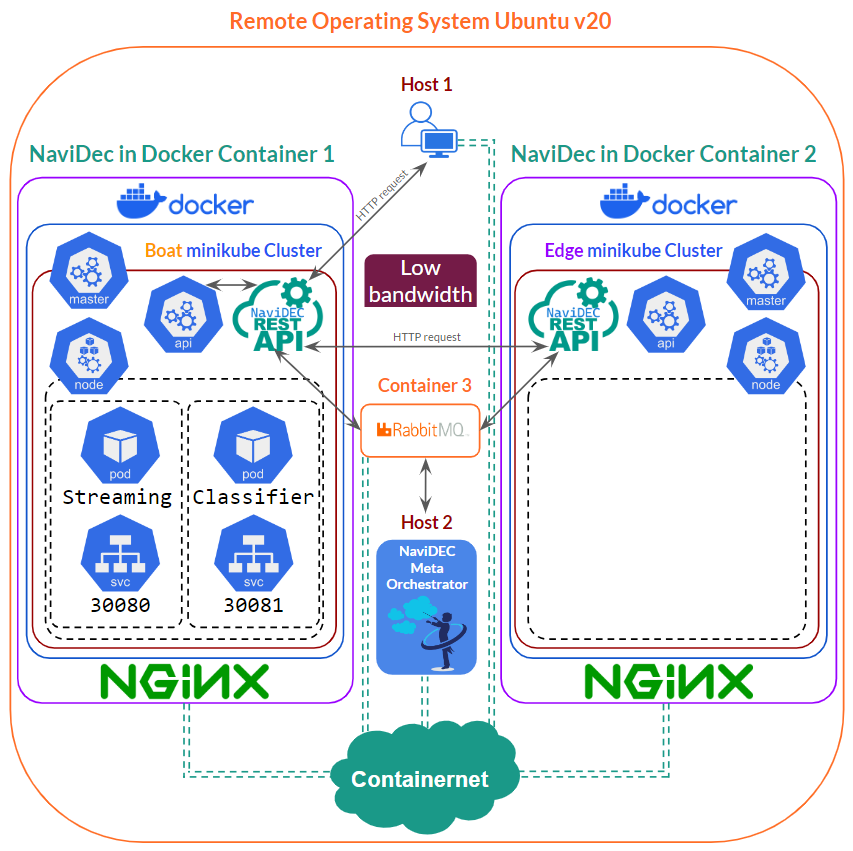
The IRISA platform is currently operating at a low bandwidth speed.
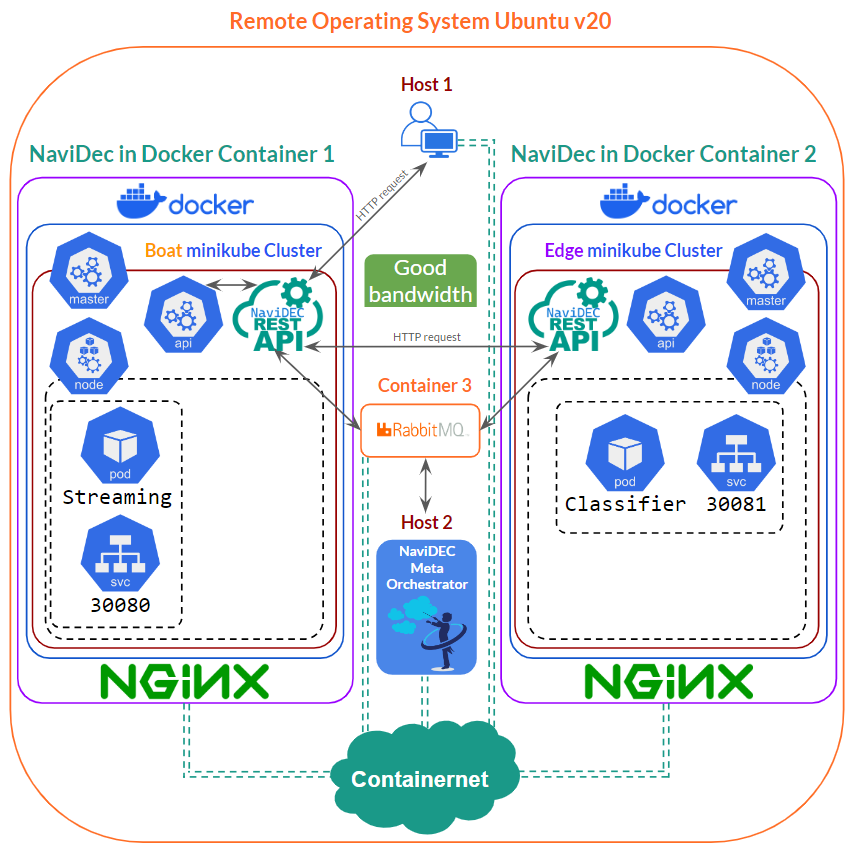
The IRISA platform is currently operating at a good bandwidth speed.
Flowcharts for Processes:
Visual representations of the flow of processes within the NaviDEC codebase, highlighting decision points and the overall sequence of operations. These diagrams were generated using the Eraser online platform, which can be found at eraser.io.
A high-quality version of the diagram is also available for download: IRISA platform Diagram.svg
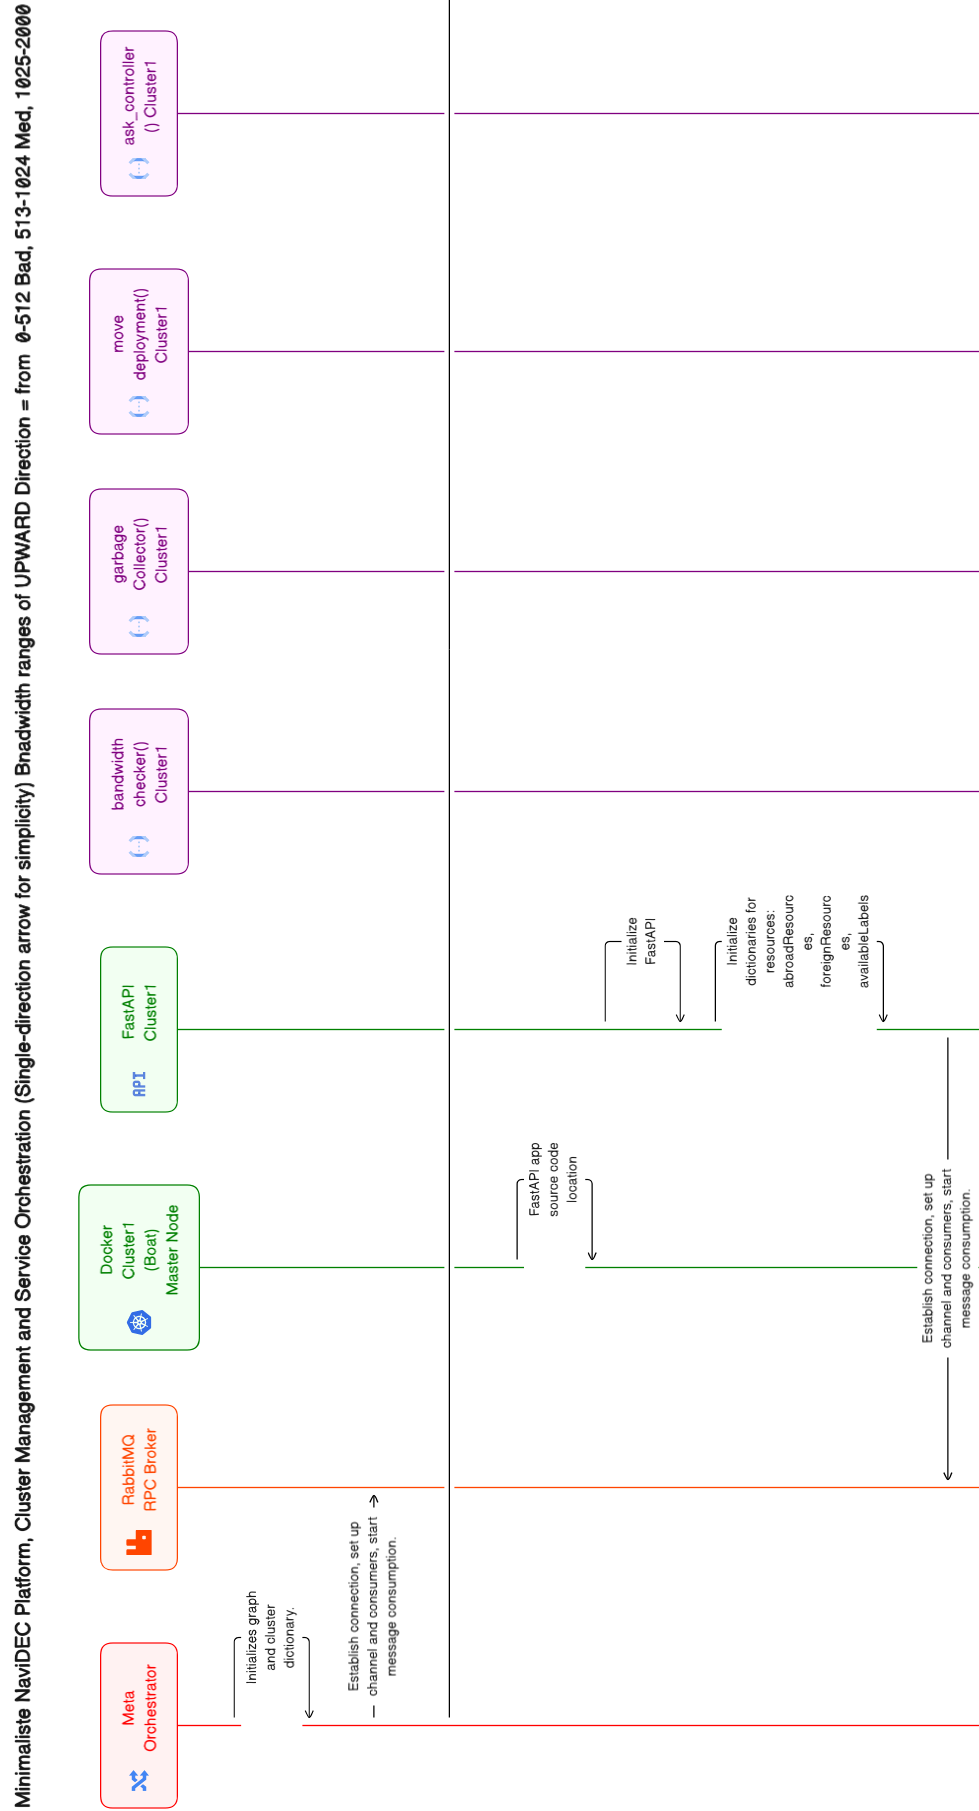
Segment of the Flowchart Diagram.
In-Depth Examination of Using Eraser Flowchart for IRISA Platform
The IRISA Platform's development workflow diagrams are efficiently managed via EraserDiagramSequence.txt, containing code used to generate flowchart diagrams on eraser.io.
Workflow Steps:
Initial Diagram Creation:
Diagrams are crafted in Eraser's online platform using code from EraserDiagramSequence.txt.
Regular Updates and Revisions:
EraserDiagramSequence.txt updates reflect architectural changes as NaviDEC codebase evolves.
Integration with Documentation:
Eraser seamlessly integrates diagrams into project documentation in SVG and PNG formats.
Eraser Diagram Sequence File:
The EraserDiagramSequence.txt file contains the necessary code to generate diagrams on the Eraser platform. Developers can leverage this file to visualize the workflow, logic, and interactions within the IRISA Platform.
Advantages of Eraser Diagrams in the Workflow:
Efficiency and Agility:
Eraser enables swift manipulation of diagrams, helping developers adapt to codebase changes.
Real-Time Collaboration:
Eraser's online platform fosters real-time collaboration, refining NaviDEC workflow jointly.
Multiple Output Formats:
Eraser exports diagrams to SVG and PNG formats.
User-Friendly Interface:
Eraser's platform simplifies diagram creation, editing, and updates for developers.
Integration with Version Control:
Include EraserDiagramSequence.txt in version control to track diagram code changes over time.
Code Repository
For more details, Click here to view the EraserDiagramSequence.txt source code.
In Summary
Diagrams enhance NaviDEC comprehension and foster collaboration. Visual aids facilitate understanding, troubleshooting, and efficient contribution. They align with IRISA Platform's transparency and robust development workflow.
Sphinx, A Comprehensive Documentation Tool
Introduction: Embracing Sphinx for Detailed Documentation
In the intricate world of software development, the IRISA platform employs Sphinx, a potent open-source tool for generating documentation. Sphinx's wide-ranging capabilities and straightforward usage make it the go-to choice for crafting detailed and aesthetically pleasing documentation. This significantly enhances the IRISA Platform's efficiency and comprehensibility.
Why Sphinx?
Sphinx is the backbone of the IRISA platform's documentation. Renowned for its support for a variety of output formats and extensive cross-references, Sphinx offers semantic markup and automatic links for a multitude of information types, including functions, classes, citations, and glossary terms. Opting for Sphinx is a testament to the project's dedication to providing a user-centric and efficient web-based documentation experience.
Benefits of Using Sphinx for documentationthe for IRISA Platform
Structured Documentation for IRISA Platform:
Leveraging Sphinx, Platform crafts organized documentation, enhancing user navigation. Sphinx's hierarchy creates defined sections, subsections, and chapters, contributing to clarity in Platform documentation.
Tailored Output Formats for Enhanced Accessibility:
Sphinx, a cornerstone of Platform's documentation strategy, supports multiple output formats including HTML, PDF, ensuring seamless access to documentation. By incorporating Sphinx, Platform enhances accessibility and usability, catering to user preferences.
Cross-Referencing and Linking for Seamless Navigation:
Sphinx enables Platform's documentation with cross-referencing between sections, creating hyperlinks and references. This improves coherence, allowing users to navigate between related topics, ensuring a comprehensive understanding of the IRISA Platform.
Efficient Search Functionality:
Platform benefits from Sphinx's built-in search functionality, enhancing the user-friendliness and efficiency of the documentation. The search bar enables swift location of relevant information, streamlining exploration of Platform's project details.
Seamless Code Integration for Developers:
Sphinx integrates with programming languages, aligning with Platform's code-centric nature, enabling inclusion of code snippets, syntax highlighting, and API documentation generation for understanding technical aspects.
Versioning Support for Ongoing Updates:
Sphinx's versioning support is invaluable for Platform during updates and releases, enabling documentation creation specific to IRISA Platform versions. Users access documentation aligning with their working version, ensuring accuracy.
Customization and Theming for Brand Consistency:
Platform uses Sphinx's customization options to align documentation with project branding. Sphinx enables a consistent and branded look across documentation, enhancing project identity.
Extensibility with Plugins to Meet Unique Requirements:
Sphinx's extensibility through plugins empowers Platform to enhance its documentation with custom features. This flexibility allows Platform to integrate additional tools, unique integrations, or customizations that meet specific project requirements, ensuring documentation evolves alongside the project.
In-Depth Examination of Sphinx Documentation for the IRISA Platform
In the IRISA Platform, Sphinx serves as the cornerstone for creating and exporting documentation in multiple formats, enhancing accessibility and user convenience. The documentation is effortlessly hosted online through GitLab Pages, ensuring continuous deployment through an automated pipeline. Here's a concise summary:
HTML Documentation:
Utilizing Sphinx, the IRISA Platform exports documentation in HTML format. The hosted HTML content is accessible online through the following link: IRISA Platform, NaviDEC Project Online Documentation
PDF Documentation:
Sphinx enables the generation of PDF documentation, providing users with a downloadable and printable version. The PDF version is conveniently hosted alongside the HTML content for user convenience. PDF version of this project is available for download: IRISA Platform, NaviDEC Project.pdf
Automated Deployment Pipeline:
The documentation deployment process is seamlessly integrated into the GitLab pipeline. As soon as content updates are made, the automated pipeline triggers a deployment to GitLab Pages, ensuring that the online documentation is always up-to-date without causing interruptions to the website.
Version Synchronization:
Both HTML and PDF versions are meticulously built and updated to reflect the most recent content changes. This synchronization guarantees that users have access to the latest version of the documentation, fostering an environment of continuous improvement.
Unified Hosting Location:
Both HTML and PDF versions of the documentation are hosted in a unified location, providing users with a centralized repository for accessing and downloading the documentation. This centralized approach enhances user convenience and ensures a consistent experience.
GitLab Pages Link:
For easy access to the online documentation, users can visit the following link: IRISA Platform, NaviDEC Project Online Documentation . This link serves as the primary entry point for exploring the comprehensive documentation provided by Sphinx for the IRISA Platform.
Illustration: Sphinx Documentation Homepage for IRISA Platform
This figure illustrates the Sphinx Documentation homepage for the IRISA Platform hosted on GitLab Pages. The URL located at the top of the page serves as the gateway to the Sphinx Documentation webpage for the IRISA Platform. The webpage is thoughtfully structured, with the main titles of the documentation prominently displayed in the left column. Correspondingly, a comprehensive list of contents related to these main titles can be found on the right. For ease of navigation, one can delve deeper into the sub-titles by simply clicking on any chosen link.
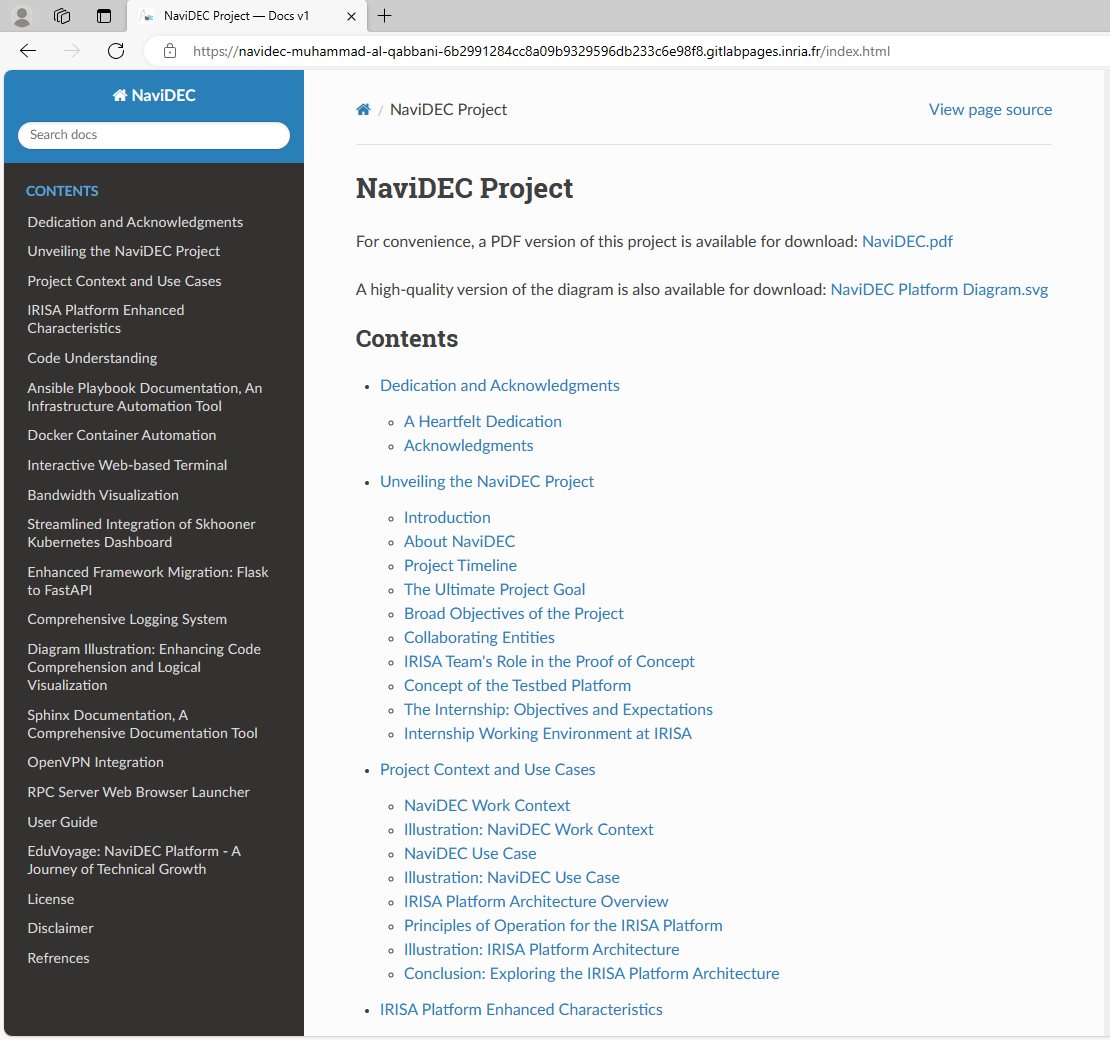
Sphinx Documentation Homepage for IRISA Platform, hosted on GitLab Pages.
In Summary
Leveraging Sphinx and GitLab Pages, the IRISA Platform seamlessly integrates well-structured documentation into its development pipeline, ensuring heightened transparency and user satisfaction. Sphinx tailors documentation for users and developers, proving invaluable across projects of diverse scales and complexities.
Code Repository
The source code for the Sphinx documentation subproject is available in NaviDEC Repository.
Automated build and deployment pipeline in GitLab
Introduction: Significance of GitLab Pipeline for Documentation
Documentation is an integral part of any software project, providing insights, guidelines, and instructions for developers and users alike. In the context of Sphinx documentation, the utilization of GitLab Pipeline introduces several advantages, addressing various challenges inherent in the traditional documentation process.
Why Gitlab Pipeline?
Learning Curve and Setup:
The learning curve for Sphinx documentation can be steep, with extensive required libraries, extensions, and themes that are approximately 3 gigabytes in size. The setup process can be time-consuming and varies based on the operating system, be it Windows or Linux.
Build and Compile Process:
Once all the required files and libraries are downloaded, a build and compile process is necessary whenever there are updates to the documentation. If we need to export HTML and PDF, we need to manually build and compile them separately, which can be time-consuming depending on the power of the CPU used.
Manual Browsing:
After the build and compile process, we need to manually browse the HTML files and PDF to ensure the changed files have been updated.
Working from Multiple Locations:
Working from multiple locations like the office and home, each with a different operating system, increases the complexity of maintaining consistency in configuration setup.
Cost-Free Deployment:
We desire a cost-free method to deploy the work on a website for easy access by relevant individuals.
GitLab Pipeline Solution:
The pipeline in GitLab can solve all above issues, and we can get the final result in less than 60 seconds.
Benefits of Using Gitlab Pipeline within IRISA Platform
Here are some benefits of using Gitlab Pipeline within the IRISA platform:
Automation:
GitLab CI/CD (Continuous Integration/Continuous Deployment) allows for the automation of the build and deployment process. This means that once you push your changes to the repository, the pipeline automatically builds your project, generates the necessary files, and deploys them.
Consistency:
By using a pipeline, you ensure that the build and deployment process is consistent and repeatable. This reduces the risk of errors that can occur when these processes are done manually.
Efficiency:
The pipeline can be configured to only build and deploy when certain conditions are met, such as a push to a specific branch like master in our project case. This saves resources by not building and deploying when it's not necessary.
Integration with GitLab Pages:
GitLab Pages is designed to work seamlessly with GitLab CI/CD. This means you can easily publish your Sphinx documentation to a web page hosted by GitLab Pages.
Flexibility:
GitLab CI/CD is flexible and can be configured to use different tools and environments. This means you can use it to build Sphinx documentation, generate HTML and PDF files, and deploy these files using Docker.
Version Control:
Since the pipeline configuration is stored in a .gitlab-ci.yml file in your repository, it benefits from version control. This means you can track changes to your pipeline configuration, revert to a previous configuration if necessary, and see who made changes.
The sequence of scripts that GitLab CI/CD runs to accomplish this task is created from a file named .gitlab-ci.yml, which you can create and modify. A specific job called pages in the configuration file makes GitLab aware that you’re deploying a GitLab Pages website.
In-Depth Examination of Gitlab Pipeline within IRISA Platform
Here is an Analysis of .gitlab-ci.yml file Configuration:
Base Image Configuration:
Utilizes a customized image based on Alpine 3.18 (moimudi/sphinx) as base image of Sphinx.
- Pages Deployment Stage:
Specifies the name of the stage in the GitLab CI/CD pipeline as 'deploy'.
Script Execution Steps:
Navigates to the 'docs' directory.
Builds the HTML documentation using Sphinx (sphinx-build -b html . public).
Builds the PDF documentation using Sphinx and latexmk (sphinx-build -b latex . _build/latex).
Executes make -C _build/latex all-pdf to compile all PDFs.
Copies the generated PDF files from _build/latex/ to the 'public' directory.
Artifacts Configuration:
Specifies the paths of the build artifacts to be stored: 'docs/public'.
Sets the expiration of artifacts to 'never', meaning they will not expire.
Publish Configuration:
Specifies the directory to publish as 'docs/public'.
Tags Configuration:
Specifies the use of a runner tagged with 'large' for this job.
Rules Configuration:
Defines conditions for job execution:
The job runs only when files in 'docs/public/' directory are changed on the master branch.
Condition: $CI_COMMIT_REF_NAME == 'master'.
Implementation Process:
The Docker image has been customized to include all required files and has been pushed to Docker Hub.
The assigned project runners in GitLab have been configured for a private server to handle downloading the Docker image, building and compiling HTML and PDF, and pushing directly to the GitLab page.
.gitlab-ci.yml file sets required information for triggering the pipeline when a change happens to Sphinx file.
Illustration: Showcasing Pipeline Stages Status
This figure illustrates image showcasing the status of Pipeline Stages for building and deploying Sphinx documentation in HTML and PDF formats on the website, executed without any service interruption. We can observe that the pipeline has successfully passed, indicated by the green color. The elapsed time is under 60 seconds, and this operation was performed under the master branch.
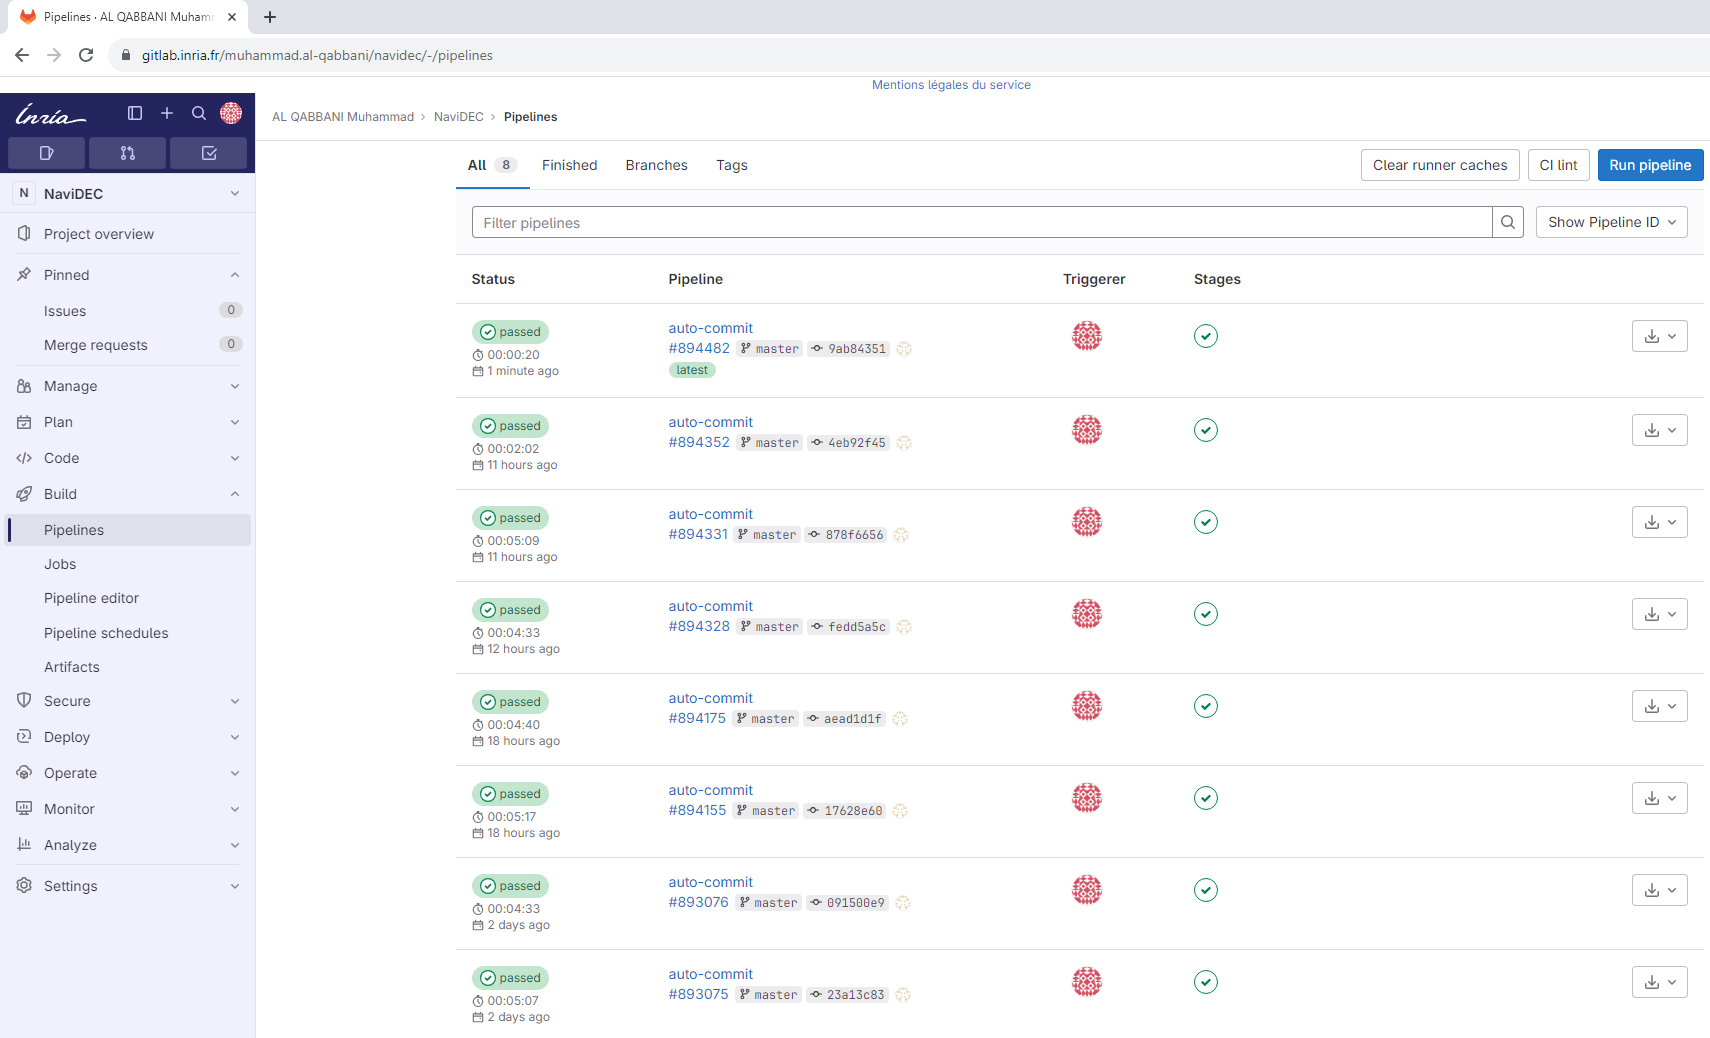
Display of Pipeline Stages Status for building and deploying Sphinx documentation.
In Summary
GitLab Pages hosts the Sphinx documentation website directly from the NaviDEC GitLab repository, while GitLab CI/CD pipelines automate building, testing, and deploying the code, streamlining development workflows for Sphinx documentation.
Code Repository
For more details, Click here to view the .gitlab-ci.yml source code.
OpenVPN Integration
Introduction: The Crucial Role of OpenVPN Integration
OpenVPN Integration within the IRISA platform emerges as a crucial augmentation, establishing a secure and dependable communication conduit. This integration plays a pivotal role in enabling the IRISA platform's remote server to establish secure connections with the user's personal computer or laptop, essential for initiating seamless communication. The implementation ensures the integrity and confidentiality of data exchanged between these endpoints. In the ensuing sections, we delve into the rationale behind incorporating OpenVPN, shedding light on its pivotal role in facilitating the IRISA platform's capability to ping and communicate with the user's personal computer or laptop. Additionally, we explore how OpenVPN contributes to streamlining automation, enabling the effortless launch of web browsers on the user's device from IRISA platform.
Why OpenVPN?
To utilize the IRISA platform, one must establish a connection to a remote server running Ubuntu 20.xx. This can be achieved from a personal computer or laptop, irrespective of whether it operates on a Windows or Linux system, by initiating an SSH terminal to connect to the remote IRISA platform.
Typically, the personal computer or laptop we use to access the remote server of the IRISA platform is connected to the internet via Network Address Translation (NAT) with a private IP such as 192.168.1.1. This IP, being non-routable through the internet, prevents the possibility of direct pinging from the IRISA platform's remote server to a private IP address, such as 192.168.1.1, assigned to the personal computer or laptop. This is a result of the inherent limitations of internet protocols.
To overcome the limitations of internet protocols, the OpenVPN program is used to establish a direct connection between the remote server of the IRISA platform and the personal computer or laptop. In this setup, the personal computer or laptop is assigned a private VPN IP, specifically 10.10.10.10, enabling effective communication with the IRISA platform. This configuration notably enhances the ability to ping from the IRISA platform's remote server to the personal computer or laptop used for access.
The main objective of this setup is to automate the process of opening a web browser on the personal computer or laptop that is used to access the IRISA platform.
This setup enables the remote server of the IRISA platform to send a command when it's ready. This command initiates a local web browser, such as Google Chrome for Windows or Firefox for Linux, on the specified personal computer or laptop. The web browser will automatically open all necessary tabs for the URLs used by the IRISA platform. This includes, but is not limited to, the xterm.js interactive terminal and bandwidth visualization.
Benefits of OpenVPN within IRISA Platform
Here are some benefits of using OpenVPN within IRISA platform:
Secure Connection:
OpenVPN provides a secure and encrypted connection over the internet between two endpoints.
Overcoming Limitations:
Enabling direct pinging from the IRISA platform's remote server to the PC or laptop.
Private Communication:
The PC or laptop is assigned a private VPN IP, enhancing privacy and security of communication.
Ease of Access:
It facilitates easy access to the IRISA platform from any location, given the availability of internet connection.
Versatility:
OpenVPN supports a wide range of operating systems, making it versatile for different users and systems.
Automation:
It automates opening a local web browser with necessary tabs for URLs used by the IRISA platform.
In-Depth Examination of OpenVPN Integration within IRISA Platform
The integration of OpenVPN within the IRISA platform involves a series of carefully orchestrated steps. The following is a detailed examination of the Ansible code used for the automated setup and configuration of OpenVPN. This will provide a comprehensive understanding of each action performed during the integration process.
Variables:
ansible_python_interpreter: /usr/bin/python3
openvpn_admin_username: "openvpn"
openvpn_admin_password: "AInRiA@2025!"
openvpn_user1_username: "work"
openvpn_user1_password: "IrisA@2025!"
openvpn_user1_ip: "10.10.10.10"
openvpn_user2_username: "works"
openvpn_user2_password: "IrisA@2025!"
openvpn_user2_ip: "10.10.10.20"
Install OpenVPN:
Update system packages.
Install required packages, including ca-certificates, wget, curl, net-tools, and gnupg.
Add OpenVPN repository key and repository.
Update package lists after adding the new repository.
Install OpenVPN.
Configure OpenVPN Settings:
Set VPN server group pool to "172.0.0.0/8."
Configure the number of TCP and UDP daemons to 4 each.
Set static network to "10.10.0.0" with a netmask of "16."
Restart OpenVPN Access Server:
Restart the OpenVPN Access Server to apply the configuration changes.
Configure VPN Client Settings:
Set client Internet traffic rerouting through VPN to false.
Do not alter clients' DNS server settings.
Restart OpenVPN Access Server to apply changes.
Configure User Settings (User 1):
Set autologin for User 1.
Change the password for User 1.
Set connection IP for User 1.
Restart OpenVPN Access Server to apply changes.
Configure User Settings (User 2):
Set autologin for User 2.
Change the password for User 2.
Set connection IP for User 2.
Restart OpenVPN Access Server to apply changes.
Configure Admin User Settings:
Set the user as a superuser.
Set user authentication type to local.
Change the password for the OpenVPN admin user.
Start OpenVPN Access Server.
Display Credentials and URLs:
Display OpenVPN admin, User 1, and User 2 credentials.
Get the current server's IP address.
Display Admin and Client UI URLs.
Illustration: Integration of OpenVPN Dashboard within the IRISA Platform
This figure presents the admin dashboard of the OpenVPN Access Server, which can be accessed via the following URL: stagepro.tk:943/admin. Notably, two usernames, work and works, have been pre-configured using Ansible and are prepared for use. This admin dashboard is designed for developer utilization.
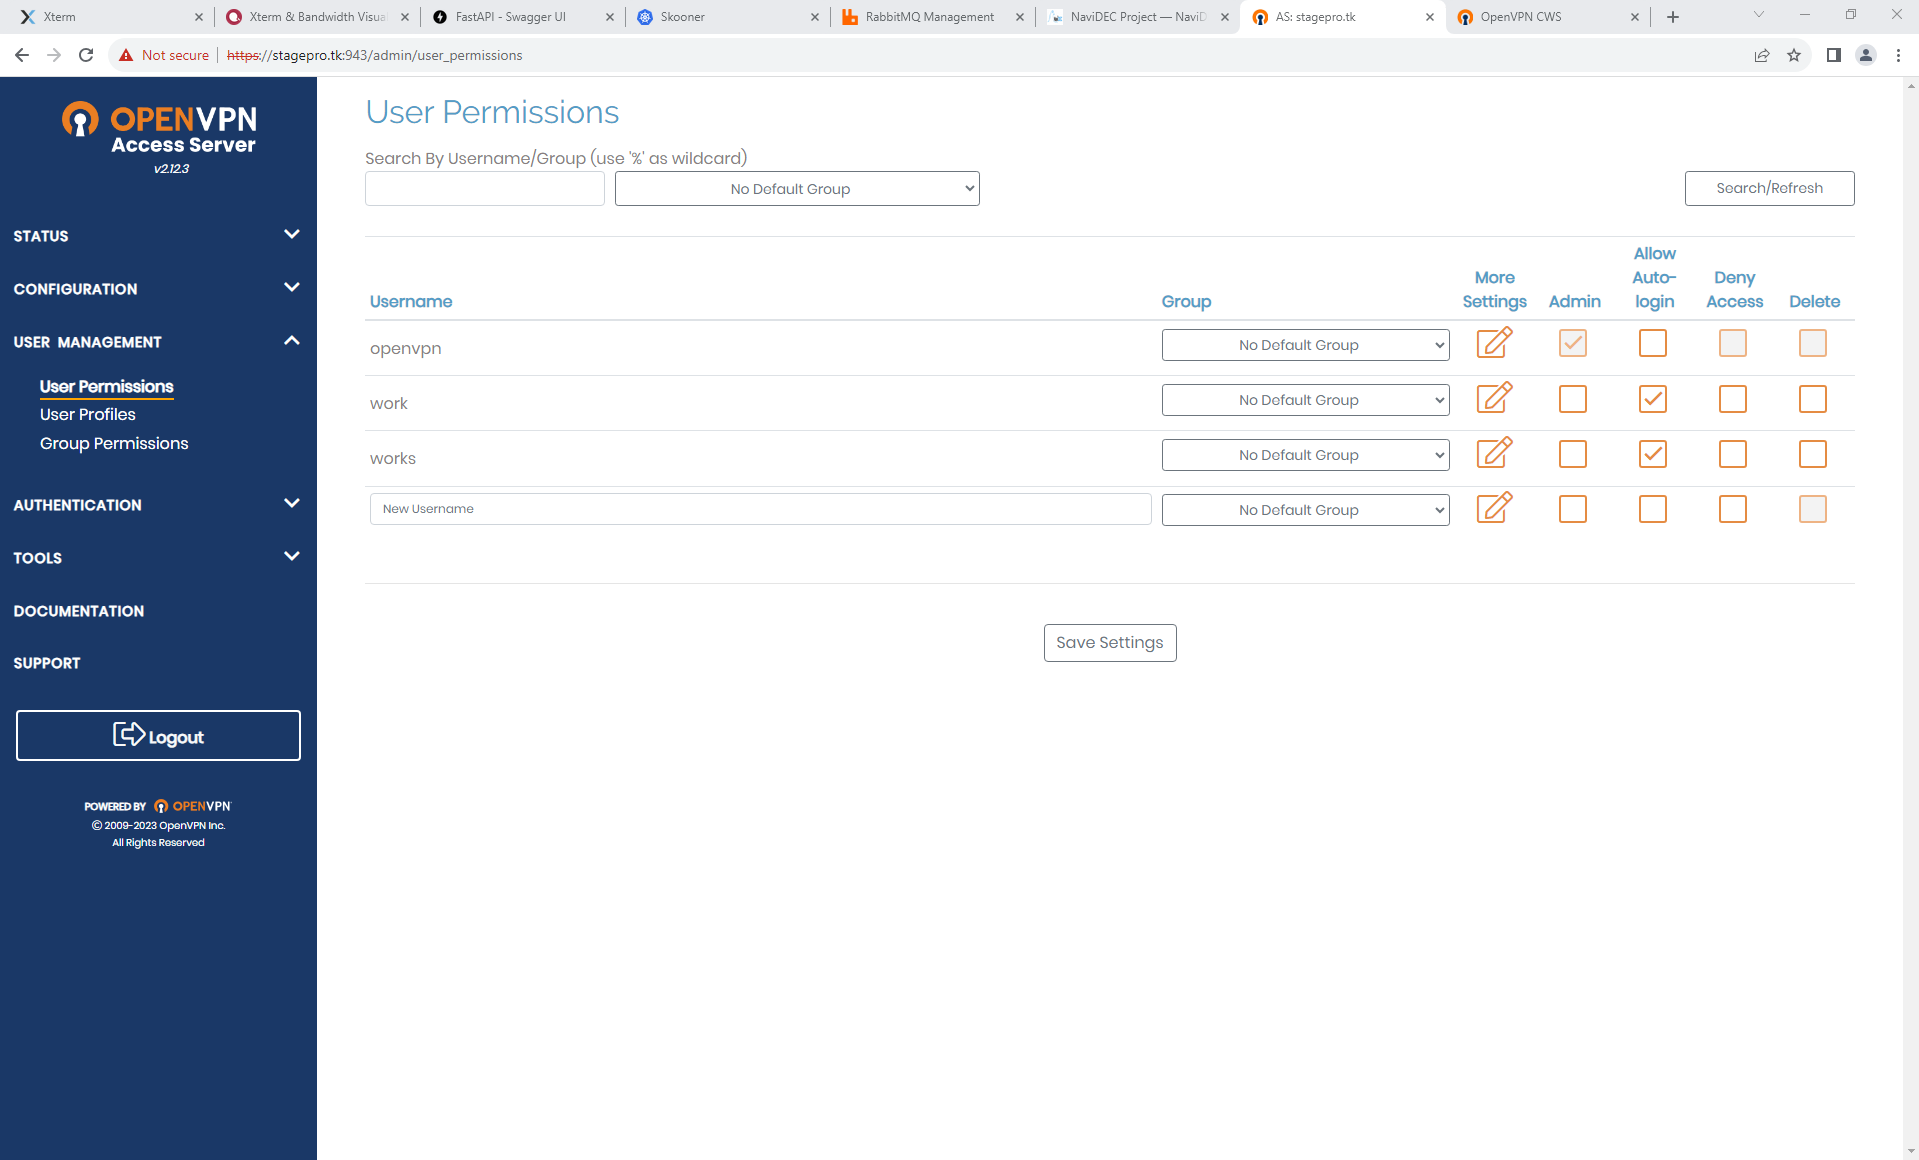
Display of OpenVPN Access Server for admin Dashboard.
This figure showcases the work user dashboard of the OpenVPN Access Server, accessible via the URL: stagepro.tk:943. Users can download the desired OpenVPN operating system. Following this, they can download and import the auto-login profile to OpenVPN and execute it to activate the connection.
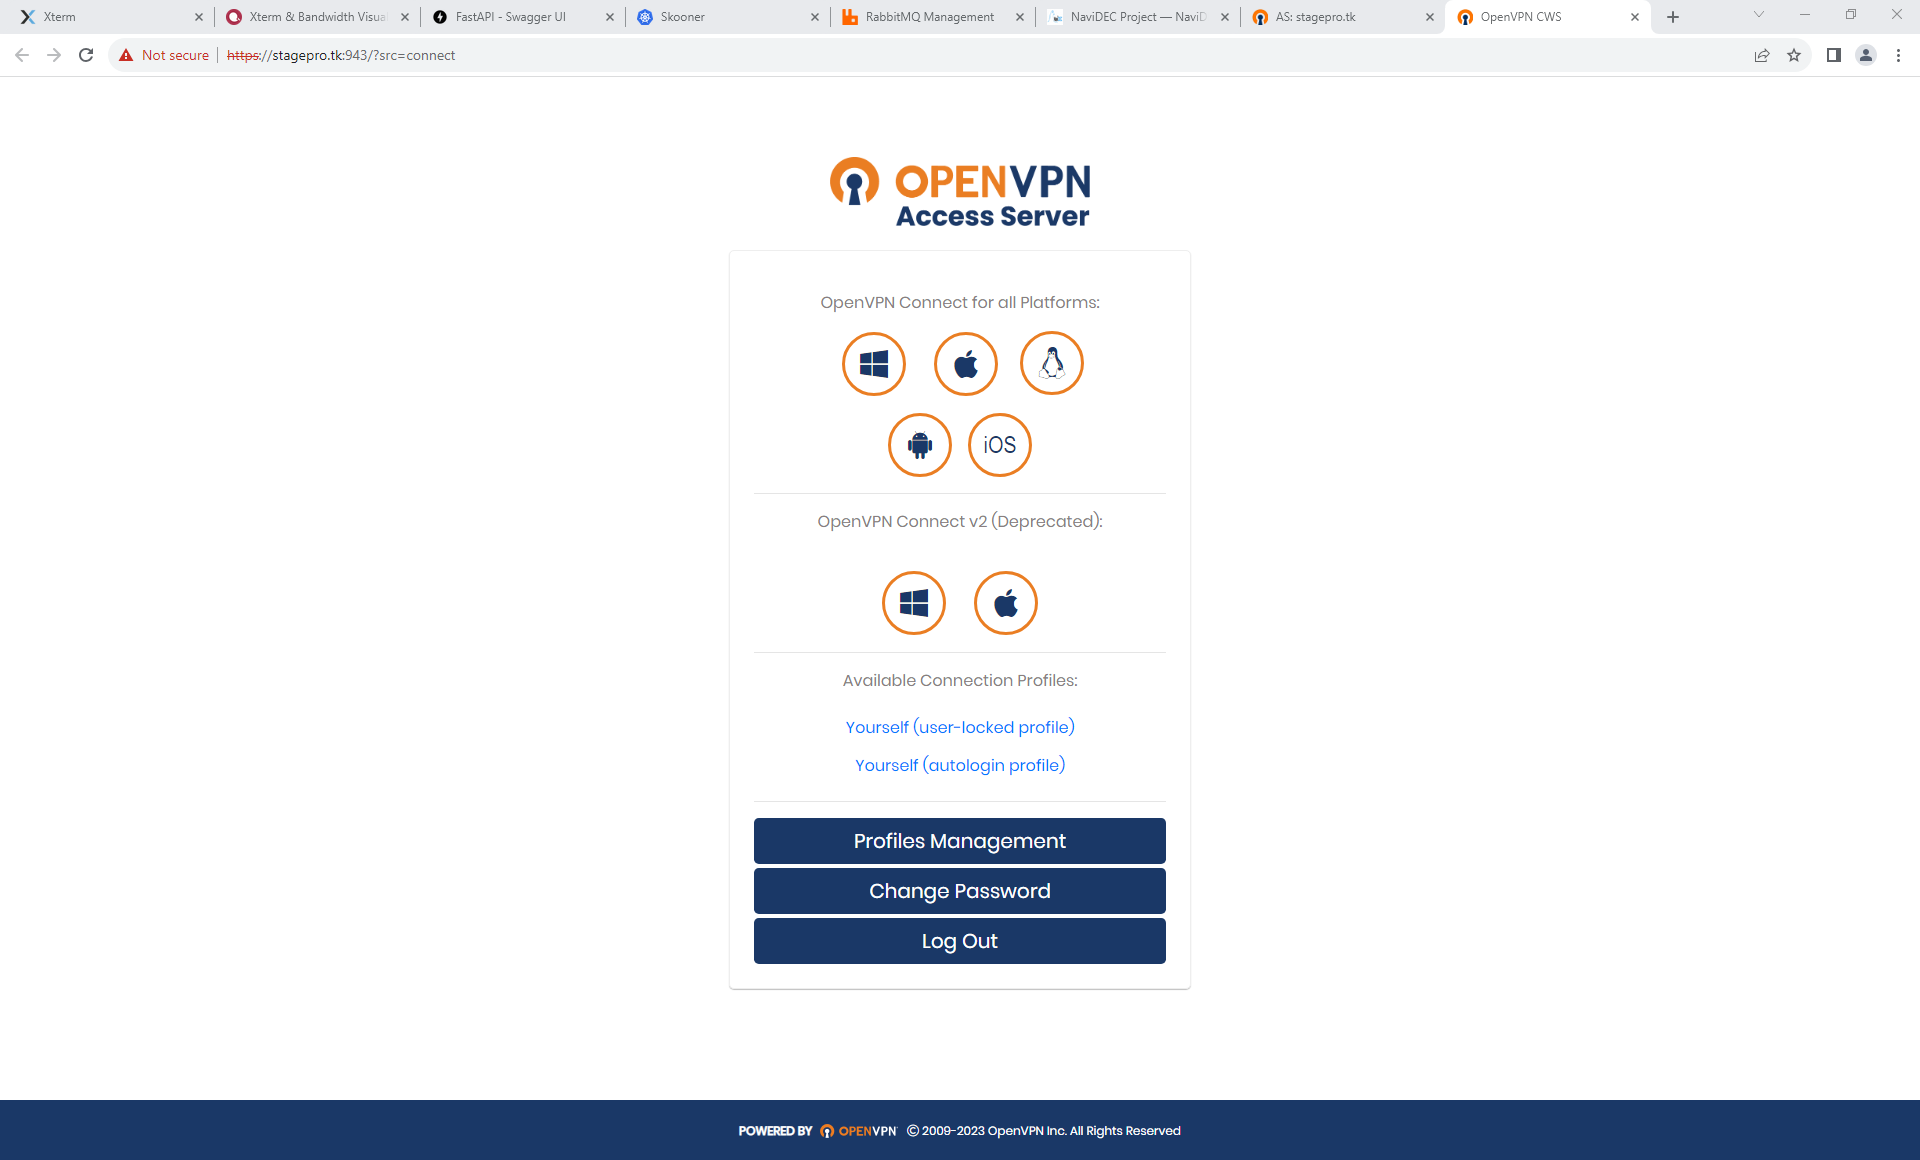
Display of OpenVPN work user dashboard.
This figure demonstrates the successful connection of the OpenVPN Connect Windows application to the stagepro.tk server using the work user profile.
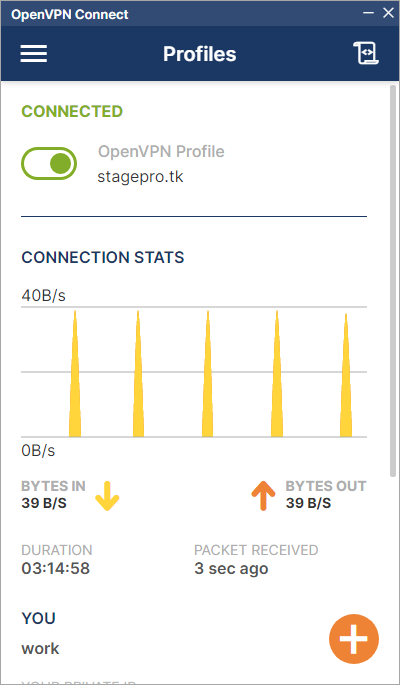
Display of successful connection of the OpenVPN Connect.
The subsequent figure illustrates the details of the work user profile within the OpenVPN Connect Windows application. It includes information such as the private IP address, which is 10.10.10.10, along with the server IP address, the VPN protocol, and the port used.
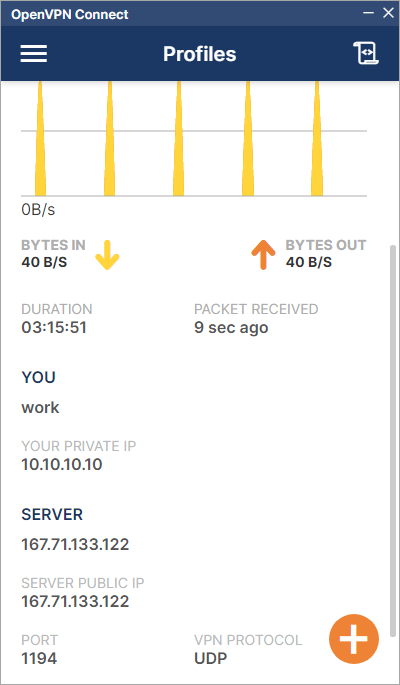
Presentation of work user profile information within the OpenVPN Connect Windows application.
In summery
OpenVPN ensures seamless integration within the IRISA platform, offering secure connections and streamlined user access.
Code Repository
For more details, Click here to view the OpenVPN integration basecode.
RPC Server Web Browser Launcher
Introduction: Revolutionizing Remote Control with RPC Server Web Browser Launcher
The RPC Server Web Browser Launcher stands as a pivotal component within the IRISA platform, designed to streamline and enhance the user experience. This innovative tool plays a crucial role in automating the launch of web browsers on personal computers or laptops, fostering seamless interaction with the resources available on the IRISA platform.
Why RPC Server Web Browser Launcher within IRISA Platform?
OpenVPN Integration
As discussed in the previous section, the integration of OpenVPN has enabled the remote Ubuntu 20.xx server of the IRISA platform to ping the destination private IP on a PC or laptop, using a private IP, specifically 10.10.10.10.
The Requirement
The subsequent requirement is to design a mechanism capable of executing a specific function: launching a web browser on the personal computer or laptop that is used to access the URL resources of the IRISA platform.
The Solution: RPC Server Web Browser Launcher
This is where the RPC Server Web Browser Launcher tool comes into play. This tool must be operational on the PC or laptop prior to establishing an SSH connection to the remote server of the IRISA platform.
The Process
Upon establishing an SSH connection to the remote server of the IRISA platform and executing the command ./run.sh, the integrated RPC client within the IRISA platform initiates a verification process to check the reachability of the RPC Server Web Browser Launcher. If it is active, the startup process of the platform proceeds.
The Result
Once the platform is operational, the RPC client sends a request to the RPC Server Web Browser Launcher to launch a local web browser, such as Google Chrome for Windows or Firefox for Linux, on the designated personal computer or laptop. The web browser automatically opens all necessary tabs corresponding to the URLs used by the IRISA platform. This includes, but is not limited to, the xterm.js interactive terminal and bandwidth visualization.
Benefits of Integrating RPC Server Web Browser Launcher with IRISA Platform
Here are some benefits of using RPC Server Web Browser Launcher with IRISA platform:
Automated Browser Launch:
The RPC Server Web Browser Launcher automates the process of launching a web browser on the user's device, enhancing the user experience and efficiency.
Seamless Interaction:
It fosters seamless interaction with the resources available on the IRISA platform by automatically opening all necessary tabs corresponding to the URLs used by the platform.
Versatility and Cross-Platform Functionality:
The tool is versatile and can work with various web browsers such as Google Chrome for Windows or Firefox for Linux. Its ability to support cross-platform functionality makes it adaptable to different user preferences and system requirements.
Efficient Communication:
By verifying the reachability of the RPC Server Web Browser Launcher, it ensures efficient communication between the IRISA platform and the user's device.
Streamlined Processes:
The tool streamlines the startup process of the platform, making it more user-friendly and efficient.
Enhanced Security and Specific Functionality:
Integration of the RPC Server Web Browser Launcher with IRISA platform enhances security of communication between the platform and user's device, ensuring the tool performs specific, designated functions. This functionality bolsters system security by minimizing potential vulnerabilities.
In-Depth Examination of RPC Server Web Browser Launcher of IRISA Platform
This Python script serves as an RPC (Remote Procedure Call) server for launching web browsers on Windows or Linux platforms. It is intended to be used in conjunction with the IRISA platform. Let's break down the key components and functionality:
Imports:
The script imports necessary modules, including os, platform, subprocess, and SimpleXMLRPCServer.
Configuration:
The IP address and port number are assigned to the variables ip_address "0.0.0.0" and port "8100" .
Color Functions:
Two functions (change_color and display_message) are defined to facilitate printing colored text to the terminal. These are used for better visibility of messages.
Function: `launch_browser(urls)`
This function is responsible for launching web browsers on the user's device based on operating system.
For Windows, it uses the psexec tool to run the start chrome --new-window command, opening a new Chrome window with specified URLs.
For Linux, it uses the firefox command to open URLs in Firefox.
Unsupported operating systems trigger an error message.
Function: `is_alive()`
This function returns a string indicating that the RPC server is alive. Registered as an RPC function.
Function: `start_server(ip_address, port)`
Sets up and starts the XML-RPC server on the specified IP address and port.
Displays a title and a message indicating the requirement for Chrome on Windows or Firefox on Linux, and advises on firewall considerations.
Registers the launch_browser and is_alive functions as RPC methods.
Initiates the server to listen for RPC calls indefinitely.
Main Execution:
Calls start_server with the specified IP address and port to start the RPC server.
Usage Notes:
Instructions are provided at the beginning, suggesting that users copy the file and run it in a separate terminal before launching the IRISA platform code.
It's assumed that Google Chrome should be installed on Windows or Firefox on Linux.
Illustration: RPC Server Web Browser Launcher
This figure illustrates the RPC Server Web Browser Launcher on windows, ready for incomming request
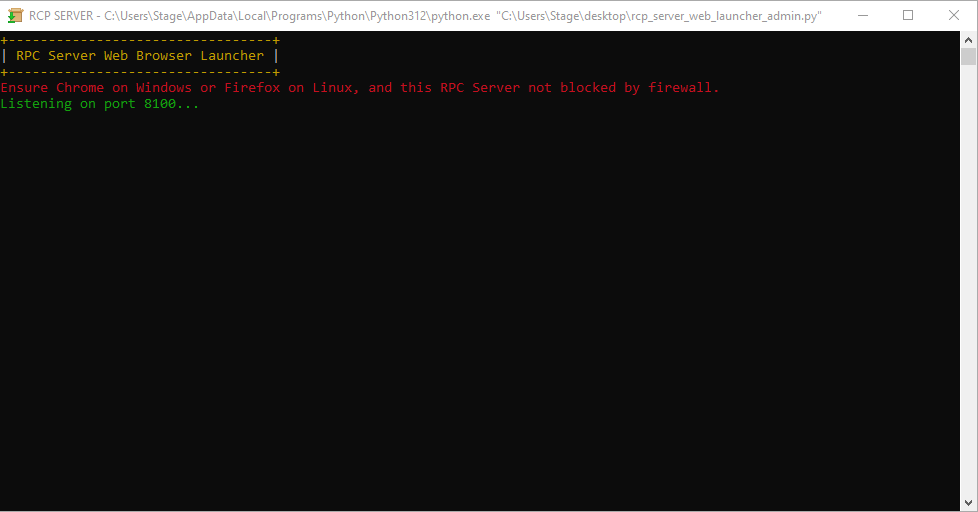
Display of RPC Server Web Browser Launcher on Windows, prepared to handle incoming requests.
This figure illustrates the RPC Server Web Browser Launcher on Windows as it receives a request.
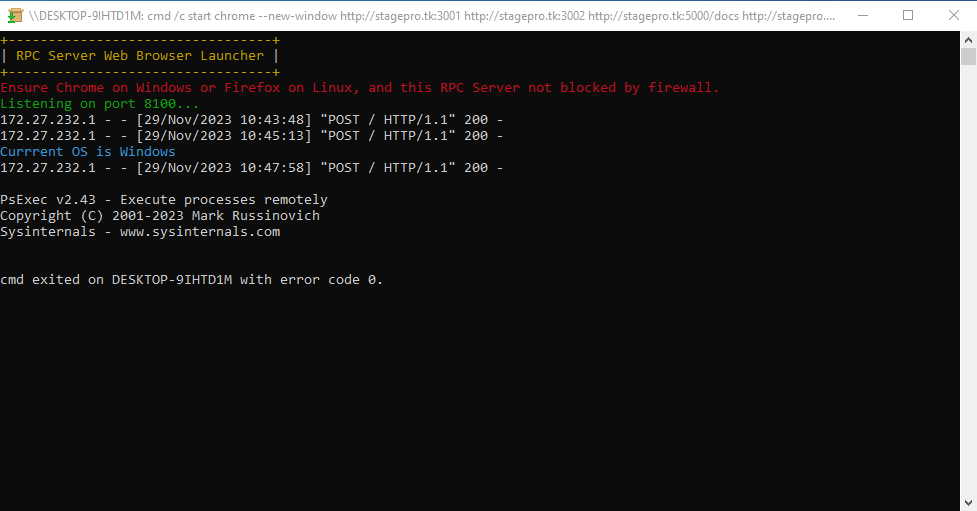
Display of RPC Server Web Browser Launcher on Windows as it receives a request.
In summary
This script sets up an RPC server to handle requests for launching web browsers. The choice of browser and the URLs to open are determined by the platform's needs. The RPC server is designed to enhance the automation and user experience when interacting with the IRISA platform.
Code Repository
For more details, Click here to view the RPC Server Web Browser Launcher basecode.
User Guide
Installation
Step 1: Bare-metal installation
Before deploying NaviDec, a prerequisite is to prepare the server. Your server should be running Ubuntu 20.04 LTS.
First, establish an SSH connection to the remote Ubuntu server and initiate the installation of Ansible on a freshly installed version of Ubuntu 20.xx:
sudo apt-get update && sudo apt-get install ansible -y
Next, clone the NaviDec repository:
git clone -b master https://gitlab.inria.fr/muhammad.al-qabbani/navidec.git
Lastly, run the Ansible playbook to install the required dependencies:
sudo ansible-playbook -i "localhost," -c local navidec/ansible/configure_server.yml && exit
Upon completion of the installation, the active terminal will automatically log out. Logging back in will allow for the re-evaluation of Docker group membership.
Step 2: Variables Configuration
The following steps will be follows for preper configuration
1- Modify the credentials_mapping in the web_launcher.py <web_launcher/web_launcher.py>__ file by replacing it with the hostname of the Linux system where the installation was finalized in Step 1 as follows.
Substitute the replaceMeWithPropperHostnameOfUbuntuLinuxOSWhereNaviDECIsInstalled variable with the hostname of the Linux system where the installation was completed in Step 1.
Set the value of OS_browser to either ‘windows’ or ‘linux’, based on the operating system of the local machine that is intended for browser launch.
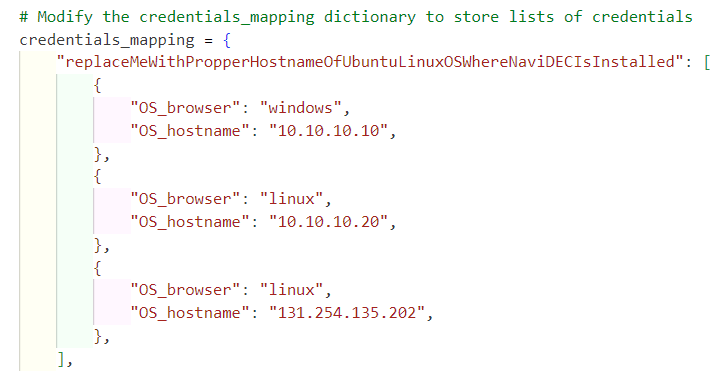
Display of credentials.
Assign the value of OS_hostname to the IP address of the local machine that is intended for browser launch.
Should the IP address value assigned to OS_hostname in Step C be a public IP address, and if it’s accessible from the remote Ubuntu Linux system to the local operating system, there’s no need to install OpenVPN on the local OS. In such a scenario, one can directly proceed to Step 2.
If the decision is made to retain the value of OS_hostname as “10.10.10.10”, it will be necessary to download the OpenVPN Access Server application that aligns with the local operating system. This can be accomplished via the following webpage: https://YourLinuxUbuntuRemoteServerIp:943. Upon downloading the OpenVPN application that corresponds with the local operating system, secure the ‘Yourself (autologin profile)’ connection profile and import it into the OpenVPN Access Server application. With these steps completed, a connection can be established.
Use the following OpenVPN client credentials to access the page:
OpenVPN URL:    https://yourLinuxUbuntuRemoteServerIp:943
Username:       work
Password:       IrisA@2025!
Display of OpenVPN work user dashboard.
2- Initiate the download and launch of the rpc_server_web_launcher.py <web_launcher/rpc_server_web_launcher.py>__ file on the local machine that is intended for browser launch. It’s crucial to confirm the pre-installation of Python 3 on this machine. Furthermore, ensure that the file isn’t hindered by any active system firewall.
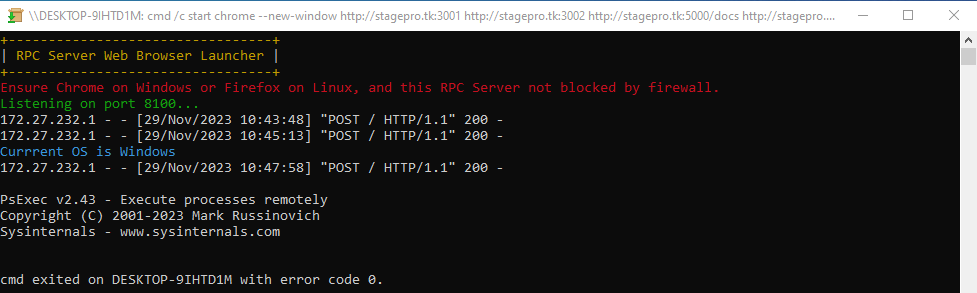
Display of RPC Server Web Browser Launcher on Windows as it receives a request.
3- Please ensure that Google Chrome is already installed if your local operating system is Windows, and Firefox if your local operating system is Linux.
4- For those using a Windows operating system, it’s recommended to execute the following command within an elevated PowerShell environment (Run as Administrator). This step is crucial for enabling the receipt of incoming ICMP echo requests, often known as “pings”.
# Import the necessary network security module
Import-Module NetSecurity

# Add a new rule to the advanced firewall settings
# This rule allows incoming ICMPv4 echo requests (pings)
netsh advfirewall firewall add rule name="ICMP Allow incoming V4 echo request" protocol=icmpv4:8,any dir=in action=allow
Please note that this command sequence first imports the required network security module, and then adjusts the advanced firewall settings to permit incoming ICMP echo requests.
5- If your remote Ubuntu server does not have a public domain name, one can edit the hosts file on your local operating system and add the IP address and hostname of the remote Ubuntu server. Here’s how one can do it:
IPaddressOfUbuntuLinux hostnameOfUbuntuLinux
In this syntax, replace IPaddressOfUbuntuLinux with the IP address of your remote Ubuntu server and hostnameOfUbuntuLinux with the hostname of your remote Ubuntu server. This will allow your local machine to recognize the remote Ubuntu server by its hostname.
The usual path to the hosts file on Windows is:
C:\Windows\System32\drivers\etc\hosts
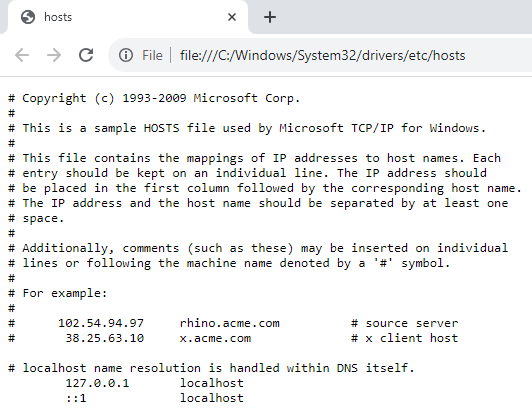
Display of windows hosts file.
And on Linux, one can find the hosts file at:
/etc/hosts
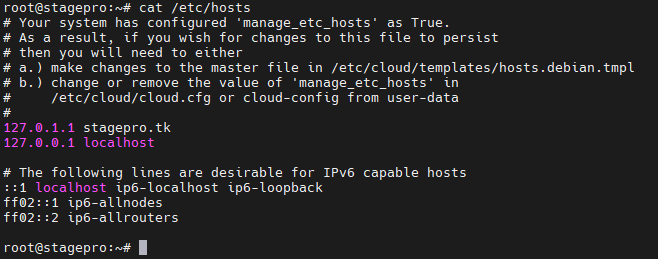
Display of linux hosts file.
Please be aware that administrative privileges may be required to modify these files.